The new inspector, with an API for AI agents
The inspector is the page at http://127.0.0.1:4040 that shows everything coming into a tunnel. In tuna-cli 0.40 we rewrote it from scratch and added what was missing: requests that used to get lost, database sessions, and an API for AI agents.
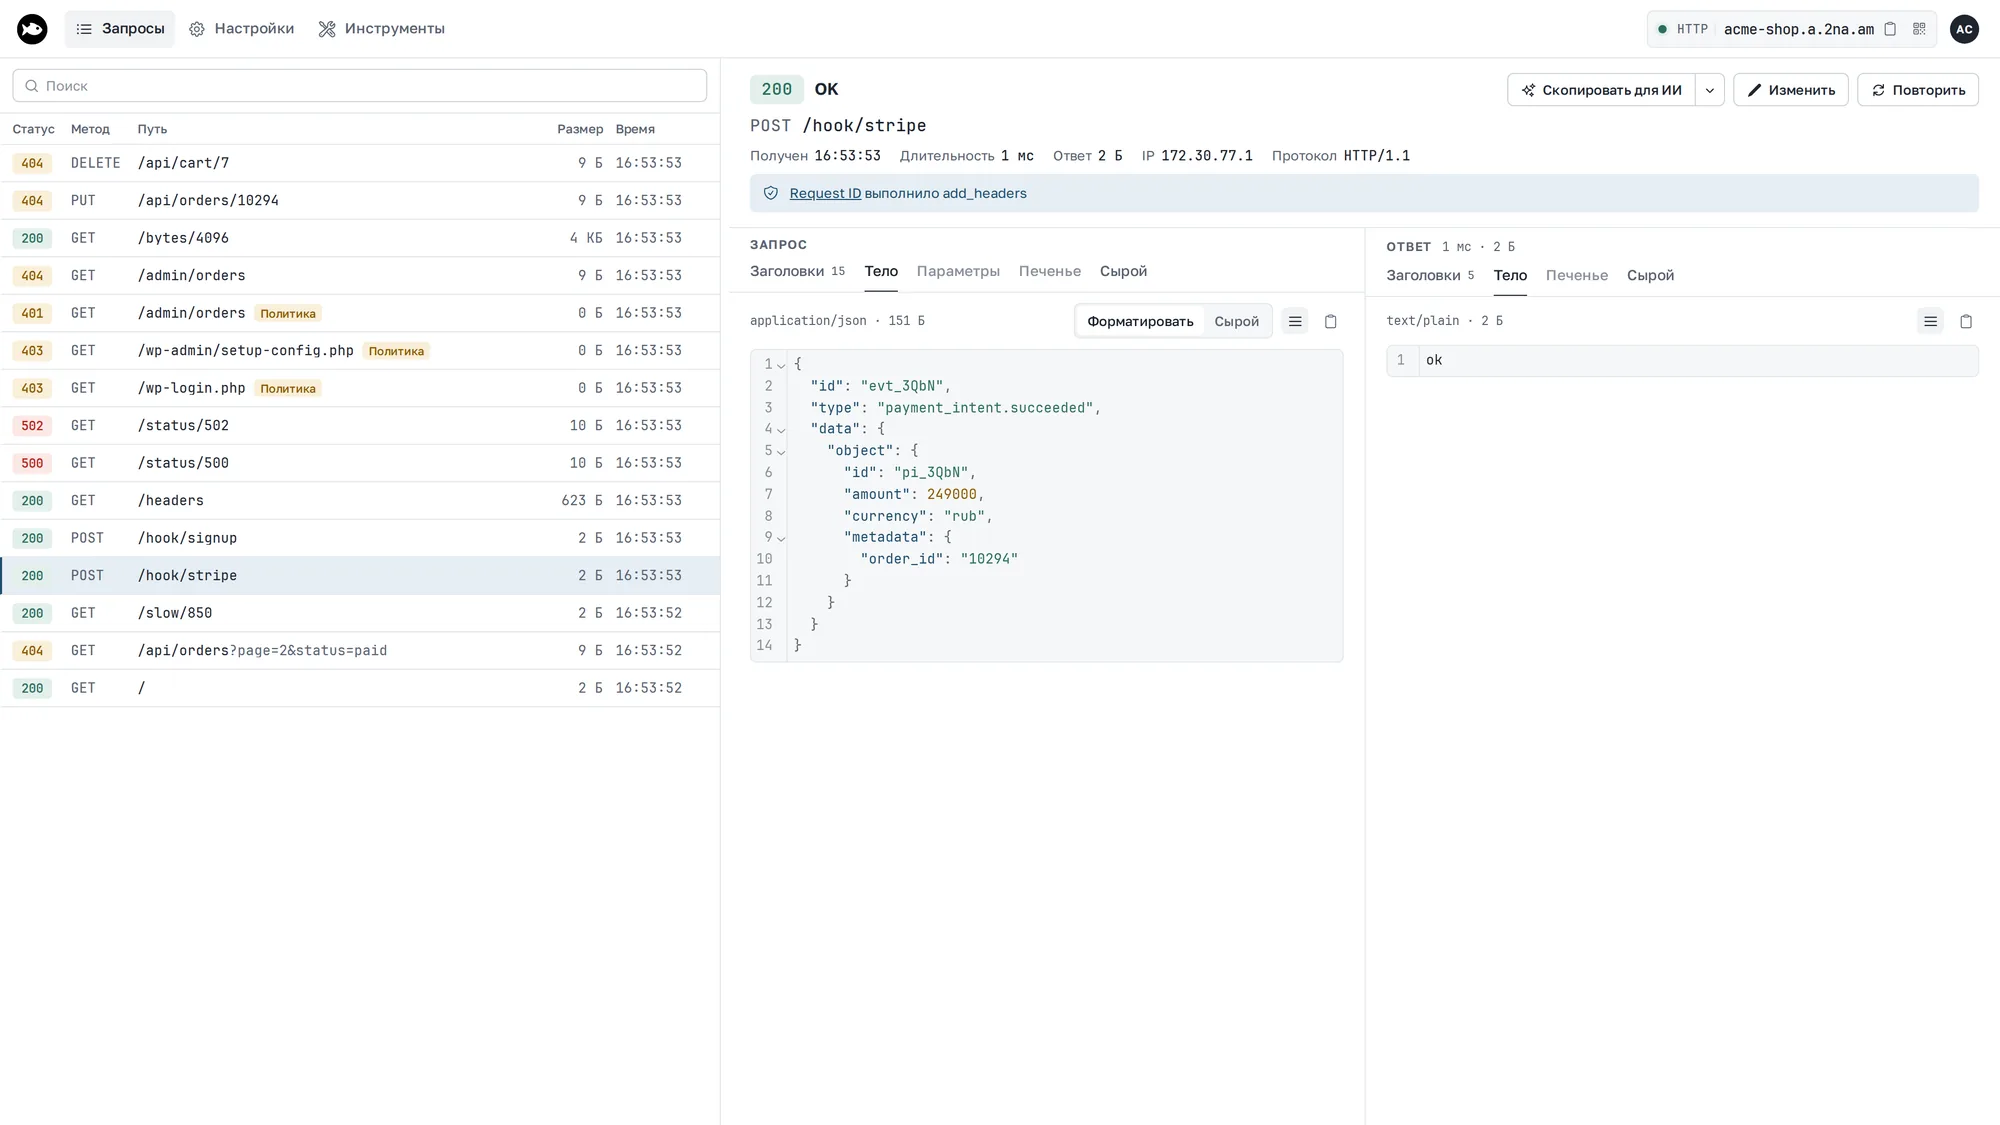
- Rejected requests are visible. A request rejected by
--basic-auth,--cidr-allow, or a traffic policy now shows up in the inspector along with the reason. - Databases. PostgreSQL, MySQL, and Redis sessions with durations, results, errors, and transactions. The MySQL tunnel is new.
- AI agents.
llms.txtand an HTTP API: an agent finds a failed request on its own, replays it, and waits for a webhook. - The inspector port is set with
--inspect-port. In Docker, the inspector is now off by default. - Everything else is in the documentation.
HTTP: everything on one screen
The request list and details take the full height of the window. On a wide monitor the request and response sit in two columns, on a laptop you switch between them, and on a phone the list and the details open as separate screens. There's now a dark theme and an English UI.
The search box understands filter tokens: method:POST, status:500, a header, an IP, a policy rule. Clicking the status or path in the details adds a filter; Alt-click adds an exclusion filter.
A token from the Authorization header opens in the JWT decoder in one click, and a timestamp opens in the time converter. We rewrote these tools in Go and covered them with tests: they no longer round large numbers, break Cyrillic in Base64, or shift the time zone.
Rejected requests
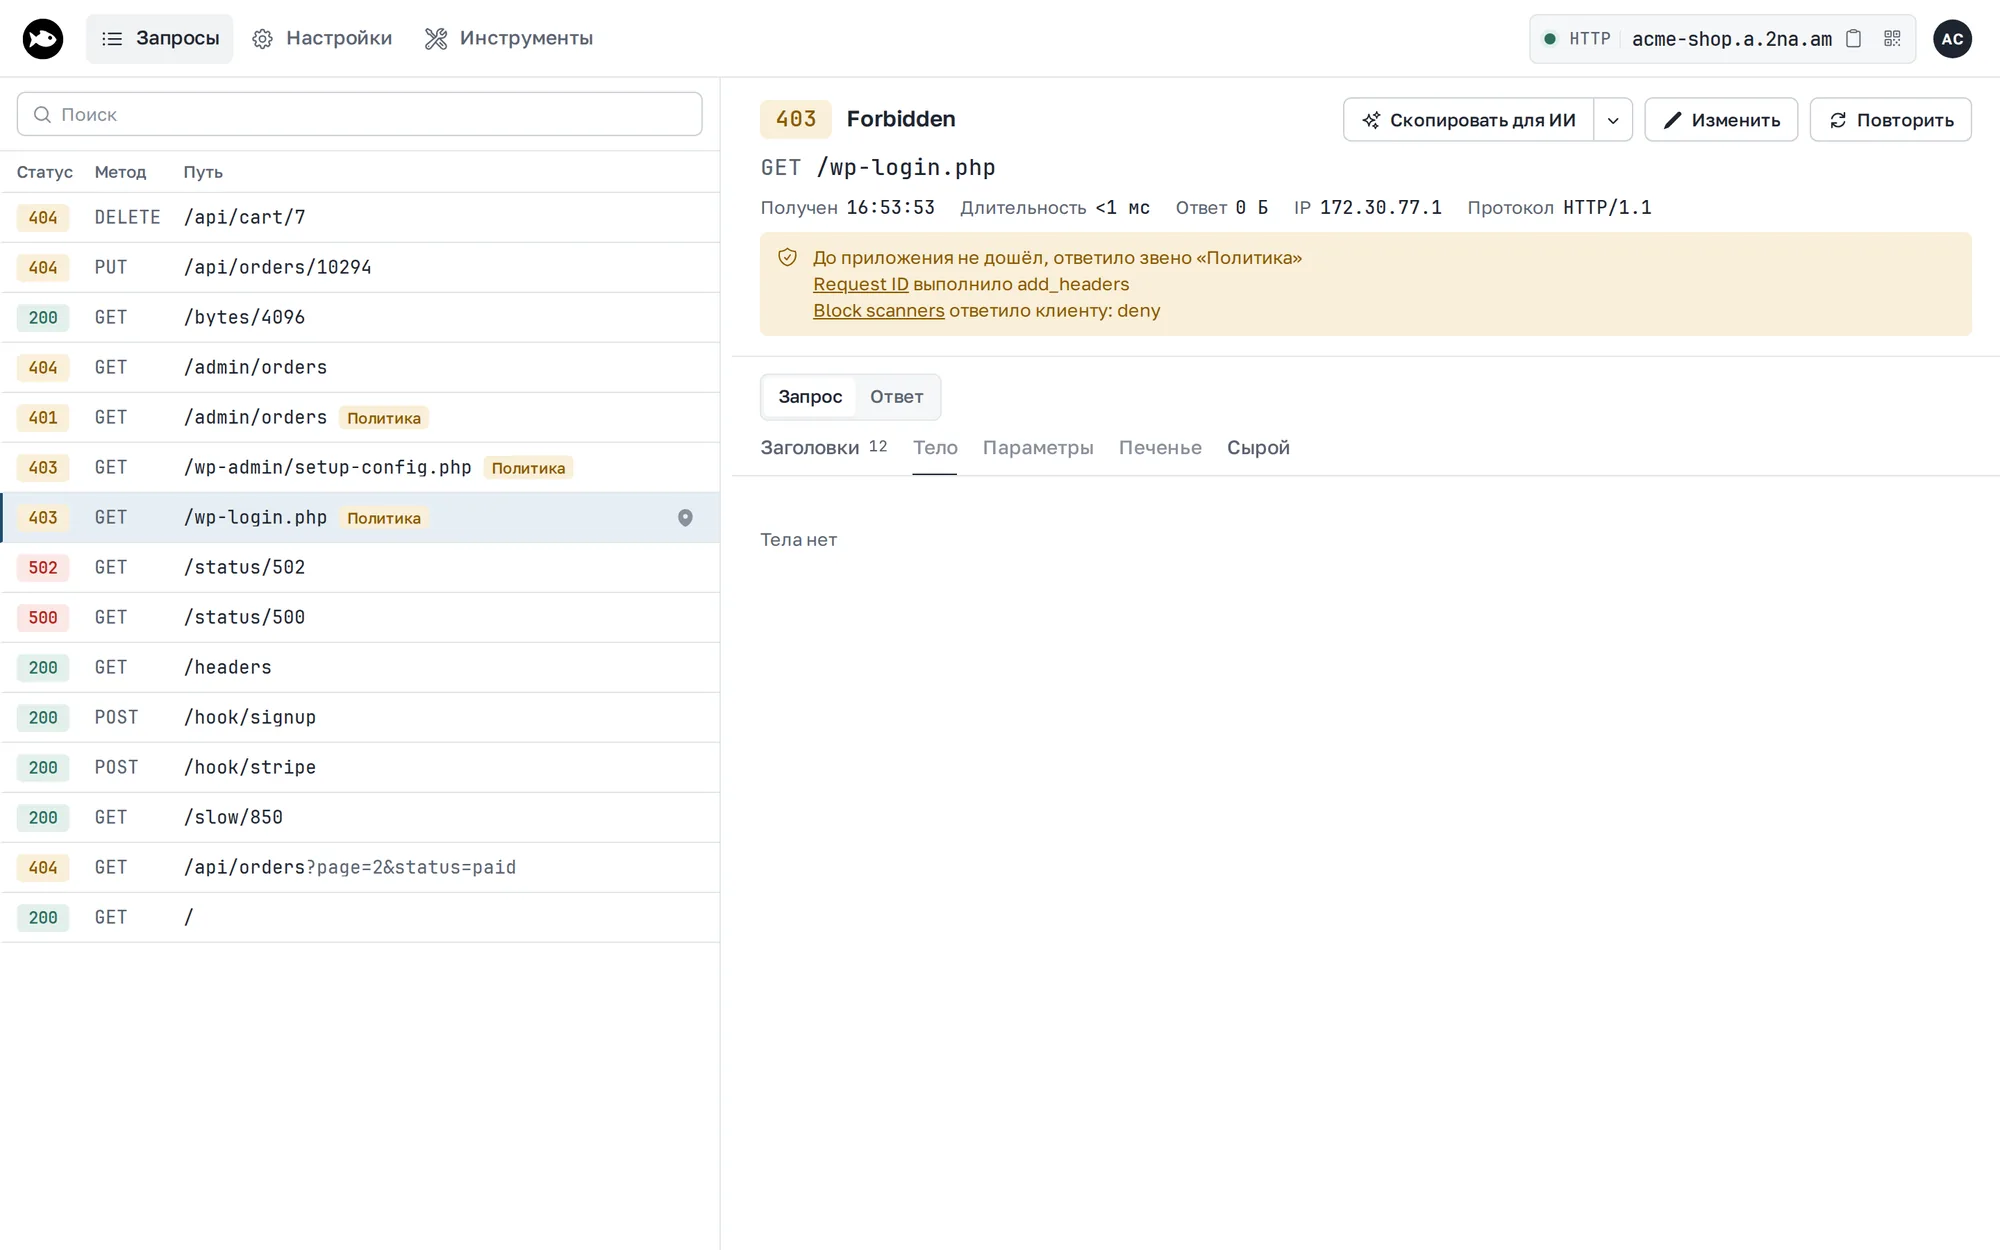
Before, a request rejected by --basic-auth, --key-auth, --cidr-*, a traffic policy, or webhook signature verification never reached the inspector. The client got a 401 or 403, the inspector stayed empty, and there was no way to tell whether the request had arrived at all.
Now these requests appear in the list with a Policy label. The details show who answered instead of the application and which rules matched.
Edit and replay
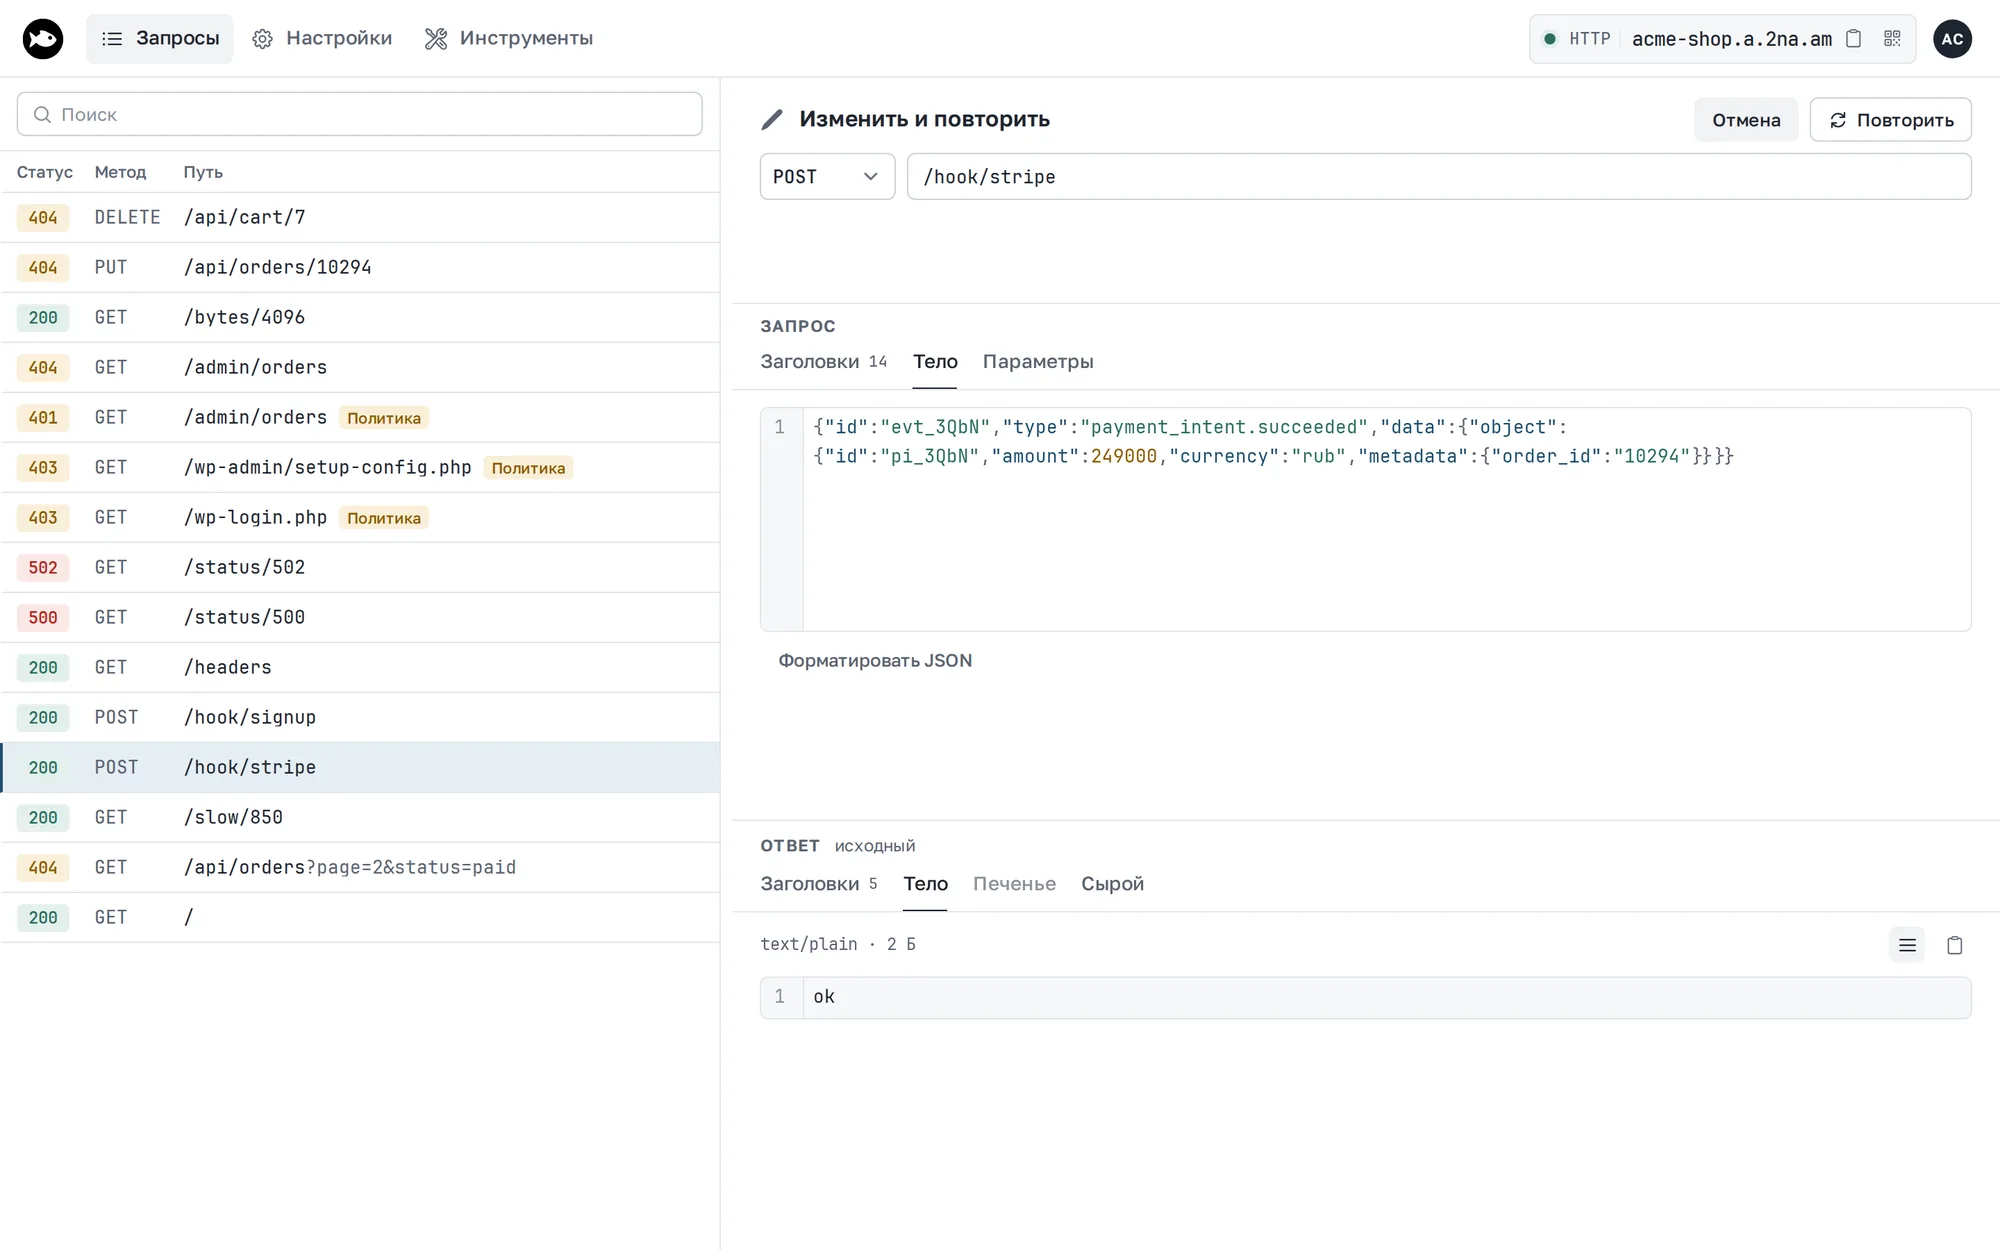
Edit opens an editor right in place of the request: method, path, headers as a table, and body, with the original response next to them. A plain replay sends the body byte for byte, so the webhook signature still matches and you can run a Stripe event through your handler again.
Databases
For tuna postgres, tuna redis, and the new tuna mysql, the inspector shows sessions and their queries: duration, result, and errors with a code and a link to its description. Transactions are marked with a bar, and rollbacks with a red one. The Errors and Slow tabs filter the log.
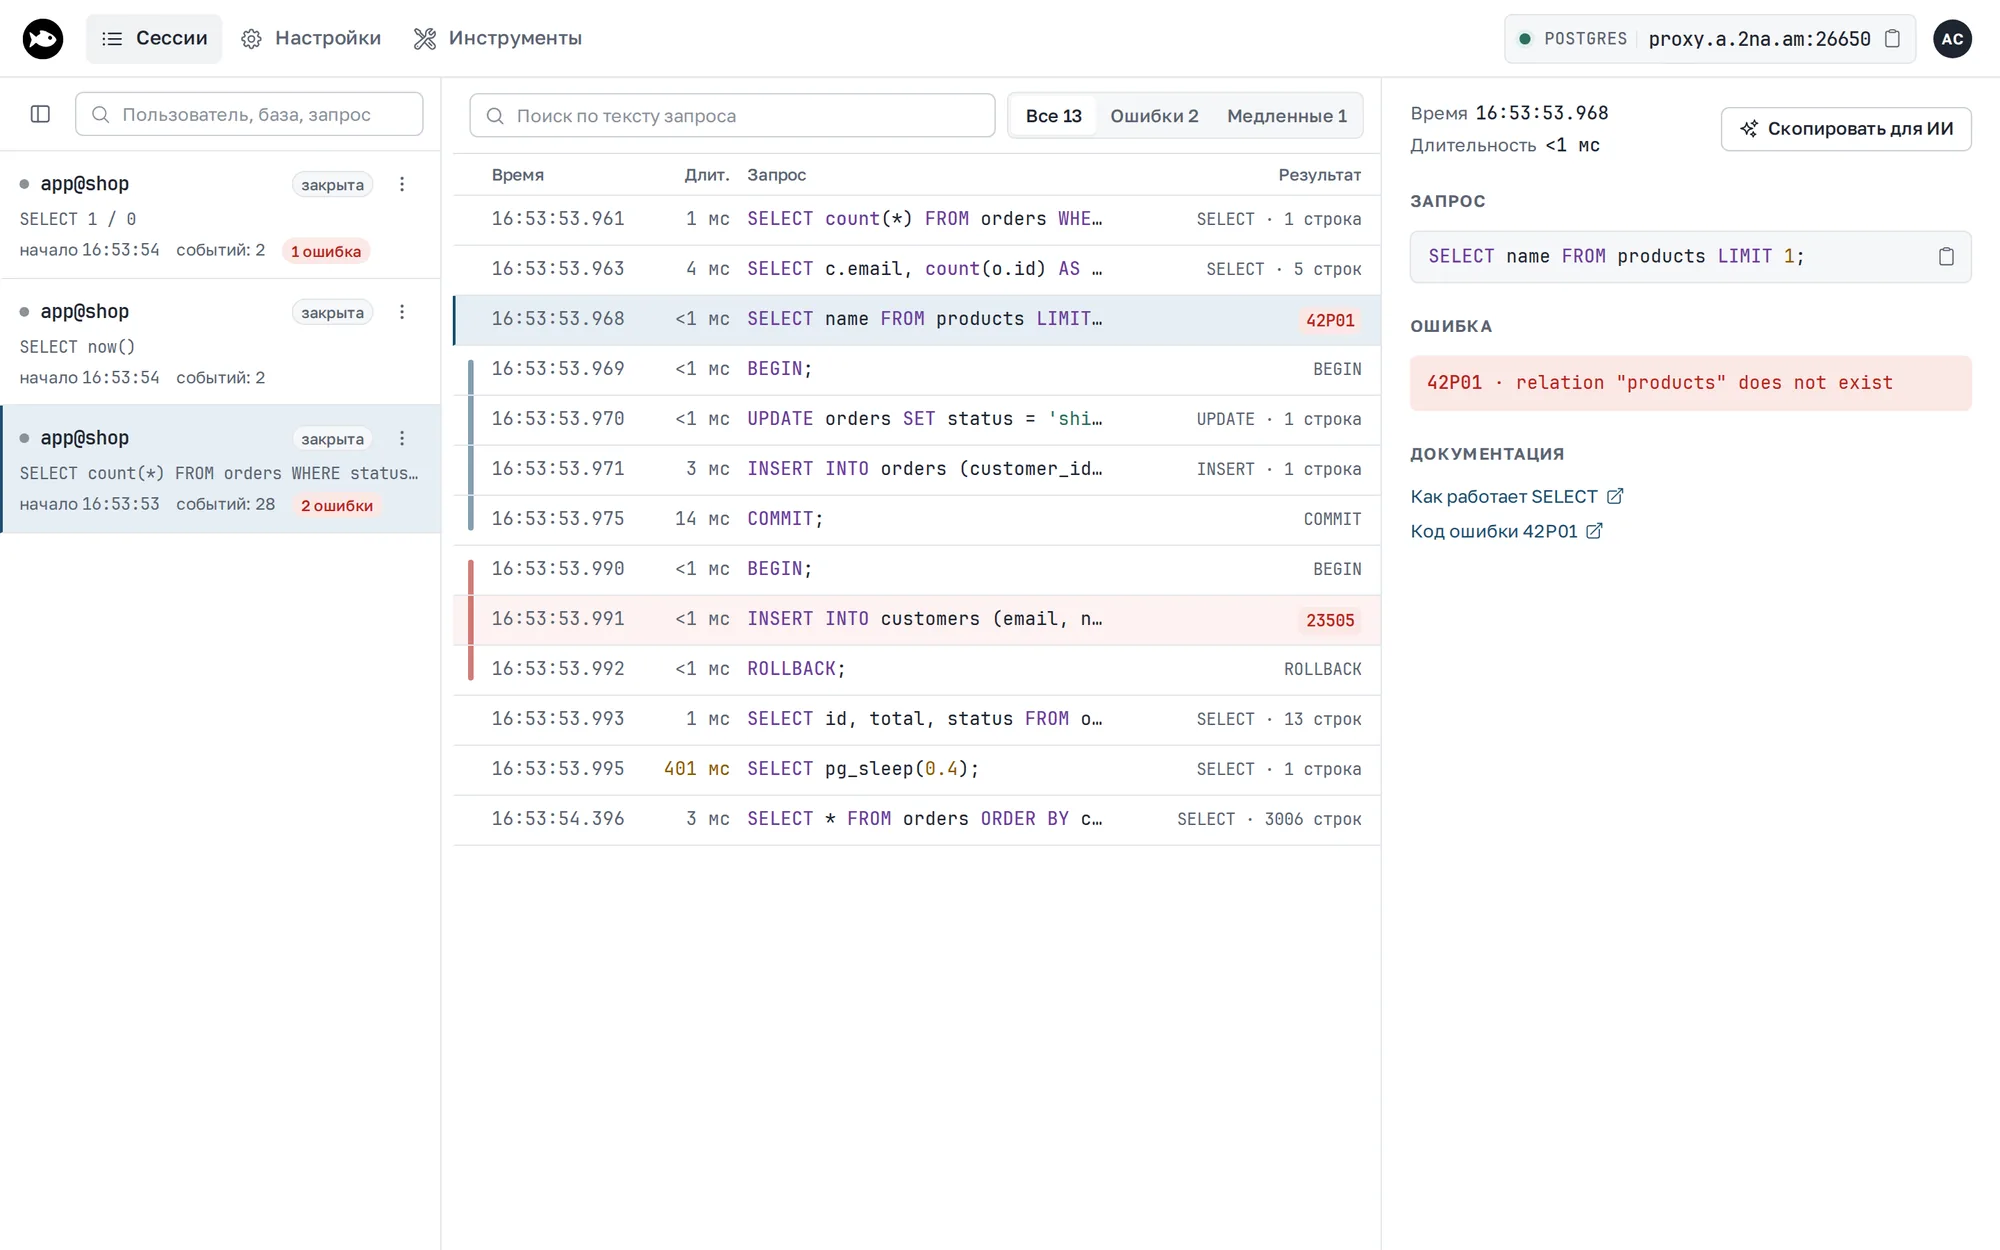
For Postgres, you see command tags (UPDATE 1) and prepared statement parameters. For Redis, you see the database number in the session name, binary values quoted the way redis-cli does it, and MULTI/EXEC. RESP3 and redis-cli --pipe work through the tunnel.
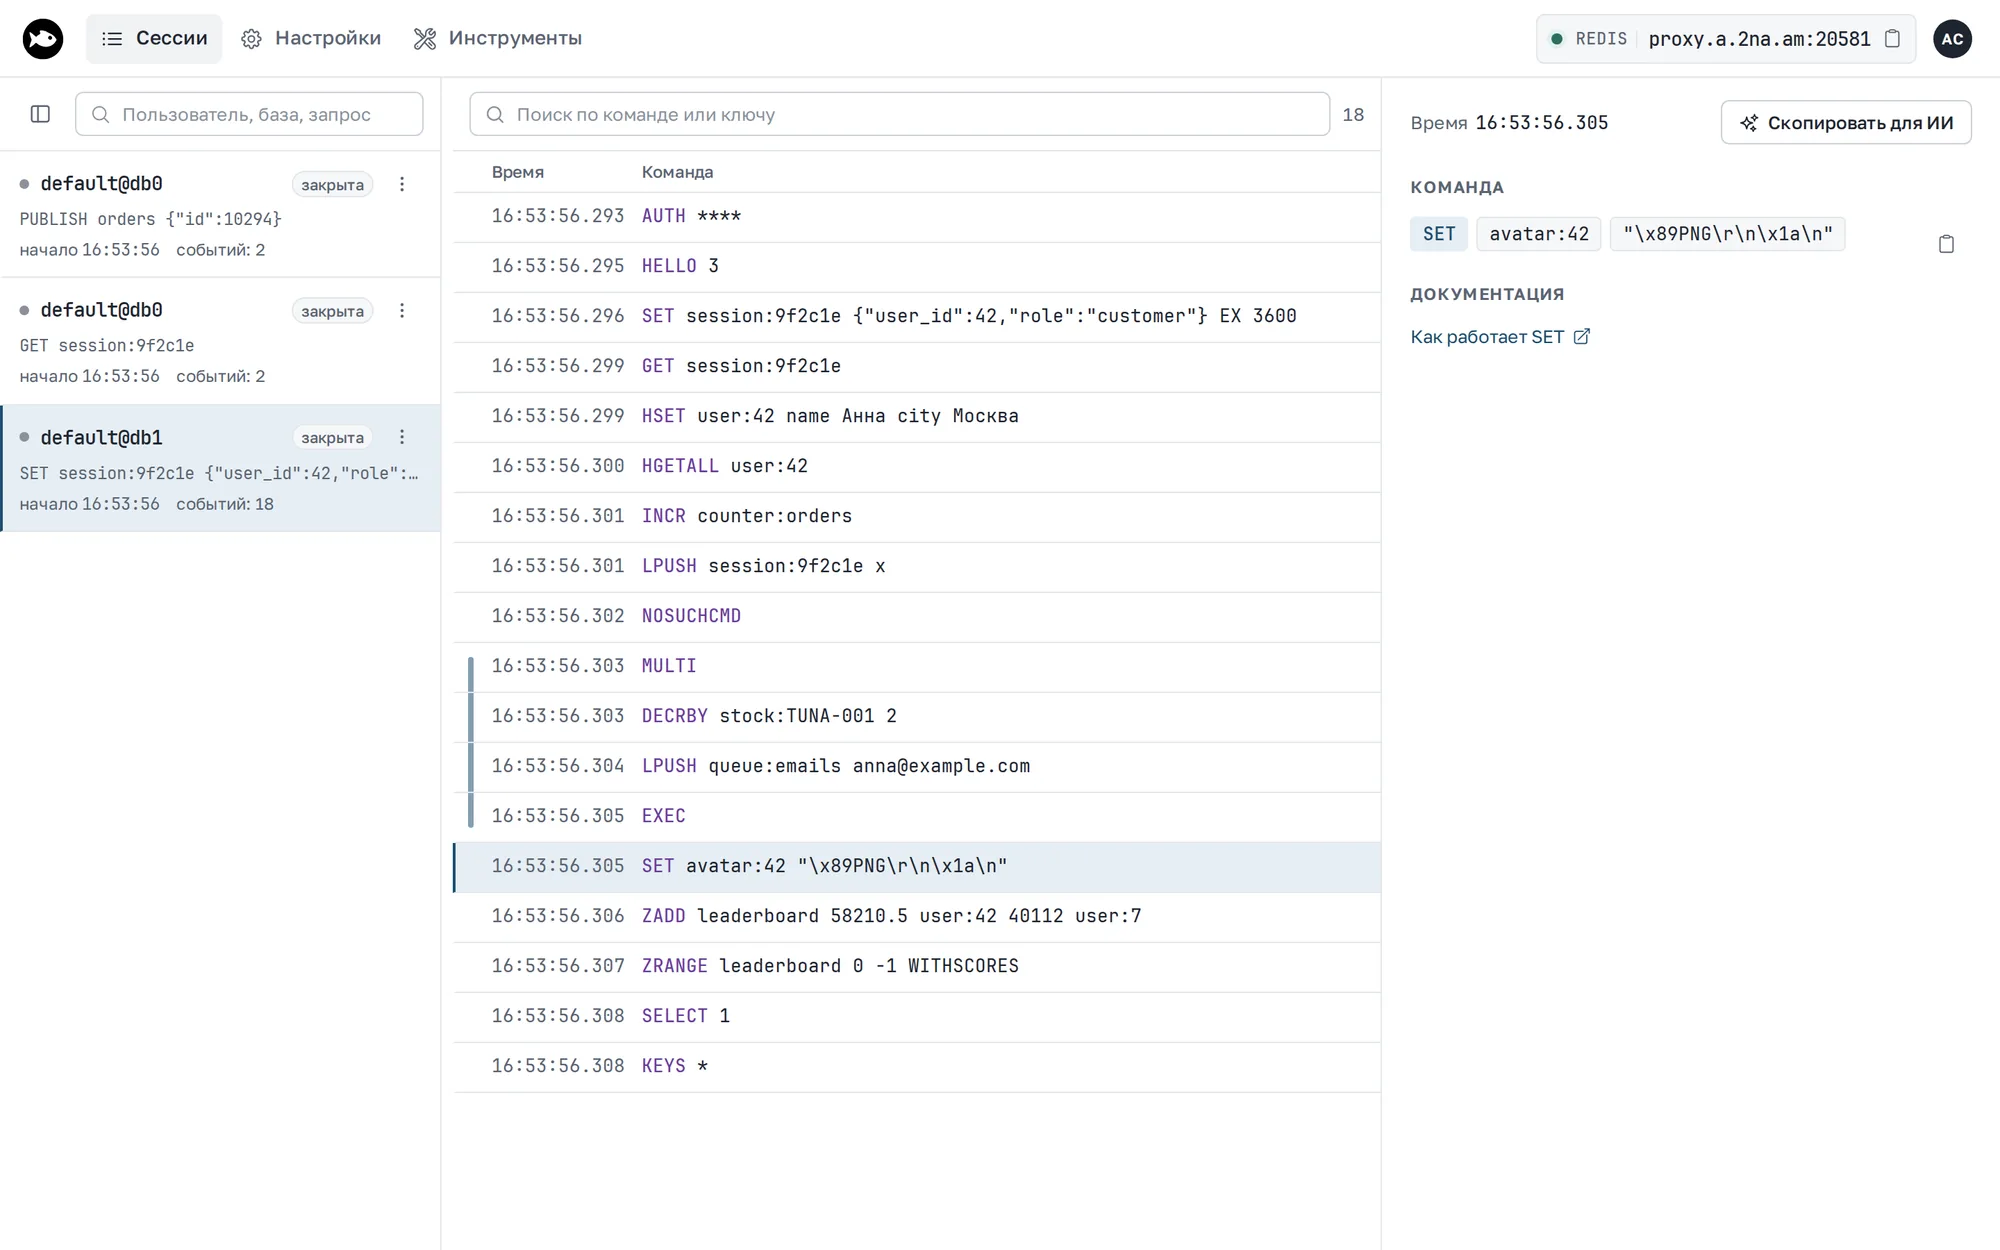
For MySQL, you see queries, transactions, and PREPARE/EXECUTE, but not results or errors: the inspector doesn't parse server responses.
The terminal shows the same thing:
AI agents
Claude Code, Cursor, and other agents read the inspector through its HTTP API. Give the agent a link to http://127.0.0.1:4040/llms.txt: it contains instructions with live addresses and ready-made curl commands.
I=http://127.0.0.1:4040
curl -s "$I/v1/events?status=5xx&since=15m"     # what failed in the last 15 minutes
curl -s "$I/v1/events?path=~hook&wait=60s"      # wait for the next webhook
curl -s -X POST "$I/v1/events/<id>/replay"      # replay through the tunnel
wait covers the common "wait for the webhook" request: the call hangs until a matching event arrives. The Copy for AI button in the request details copies a link to the event: a person who opens it sees the inspector screen, and an agent gets Markdown.
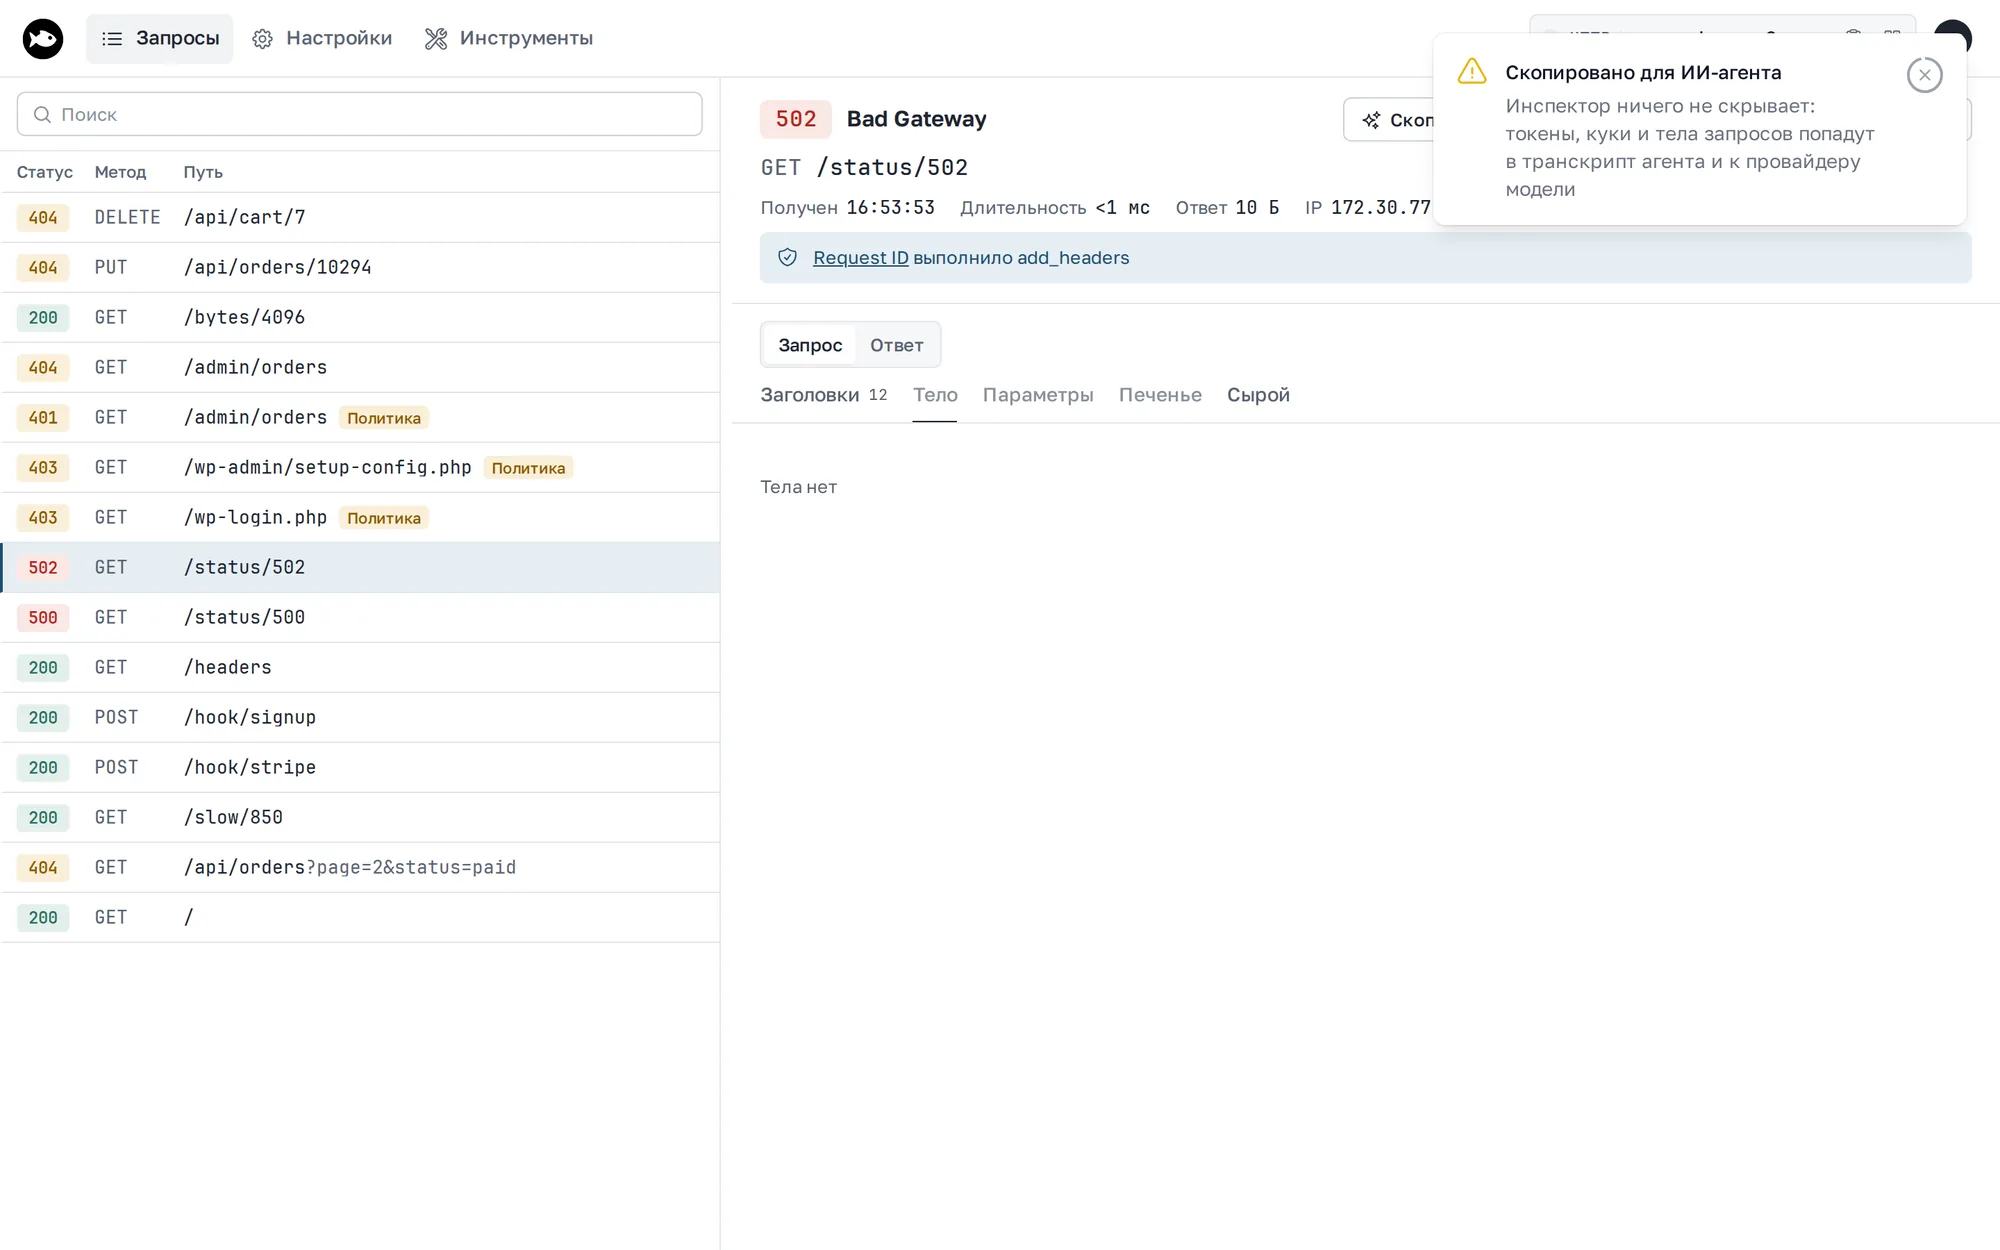
The inspector masks nothing: tokens, cookies, and request bodies end up in the agent's context and with the model provider. It warns about this when you copy, and llms.txt asks the agent not to repeat secrets. Be careful with production data.
What changes when you upgrade
- Port. The first tunnel takes 4040, the next ones 4041, 4042, and so on. Set a fixed port with
--inspect-portorTUNA_INSPECT_PORT. If that port is busy, the tunnel fails to start and names whoever holds it. inspectAddrintuna.ymlis no longer read. Set the address withTUNA_INSPECT_ADDR; a port in it is deprecated.- Docker. In the
yuccastream/tunaimage, the inspector oftuna http,tuna 1c, andtuna kubernetesis off. If you only setTUNA_INSPECT_ADDR, addTUNA_INSPECT=true. - Network access. With
TUNA_INSPECT_ADDR=0.0.0.0, the CLI logs a warning and the inspector shows a banner saying it's open without authorization.
See the guide for how to update the CLI. Details are on the inspector page. Found a bug or missing a feature? Contact support.
Leave feedback
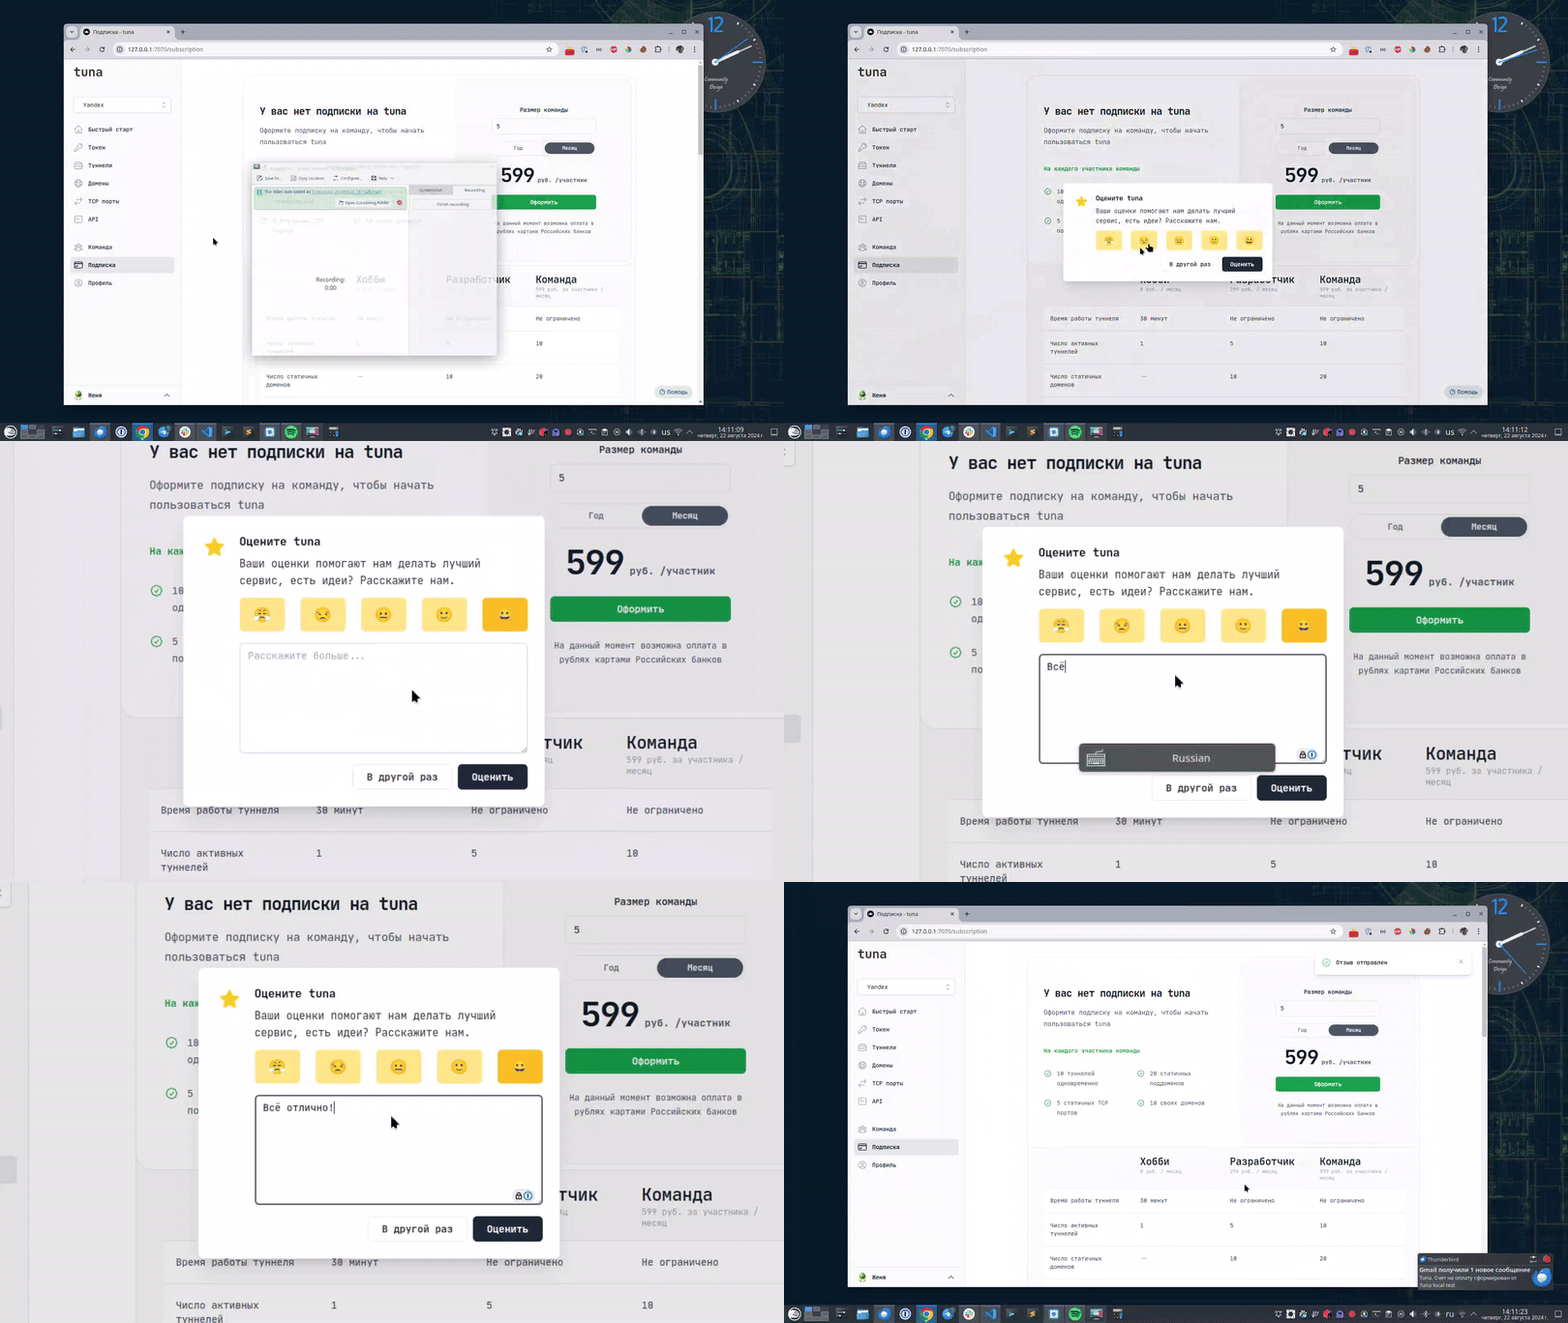
If you enjoy using Tuna, or on the contrary you are not happy with something, please leave feedback.
News
We announce new features and posts on our Telegram channel. Subscribe so you don't miss anything.
Help
We value our users and carefully review every request. If you have any problems with tuna, please contact us in one of the following ways: