Monitors
Functionality for monitoring CronJobs, Heartbeat, ICMP, DNS, HTTP and TCP applications with notification support through various communication channels.
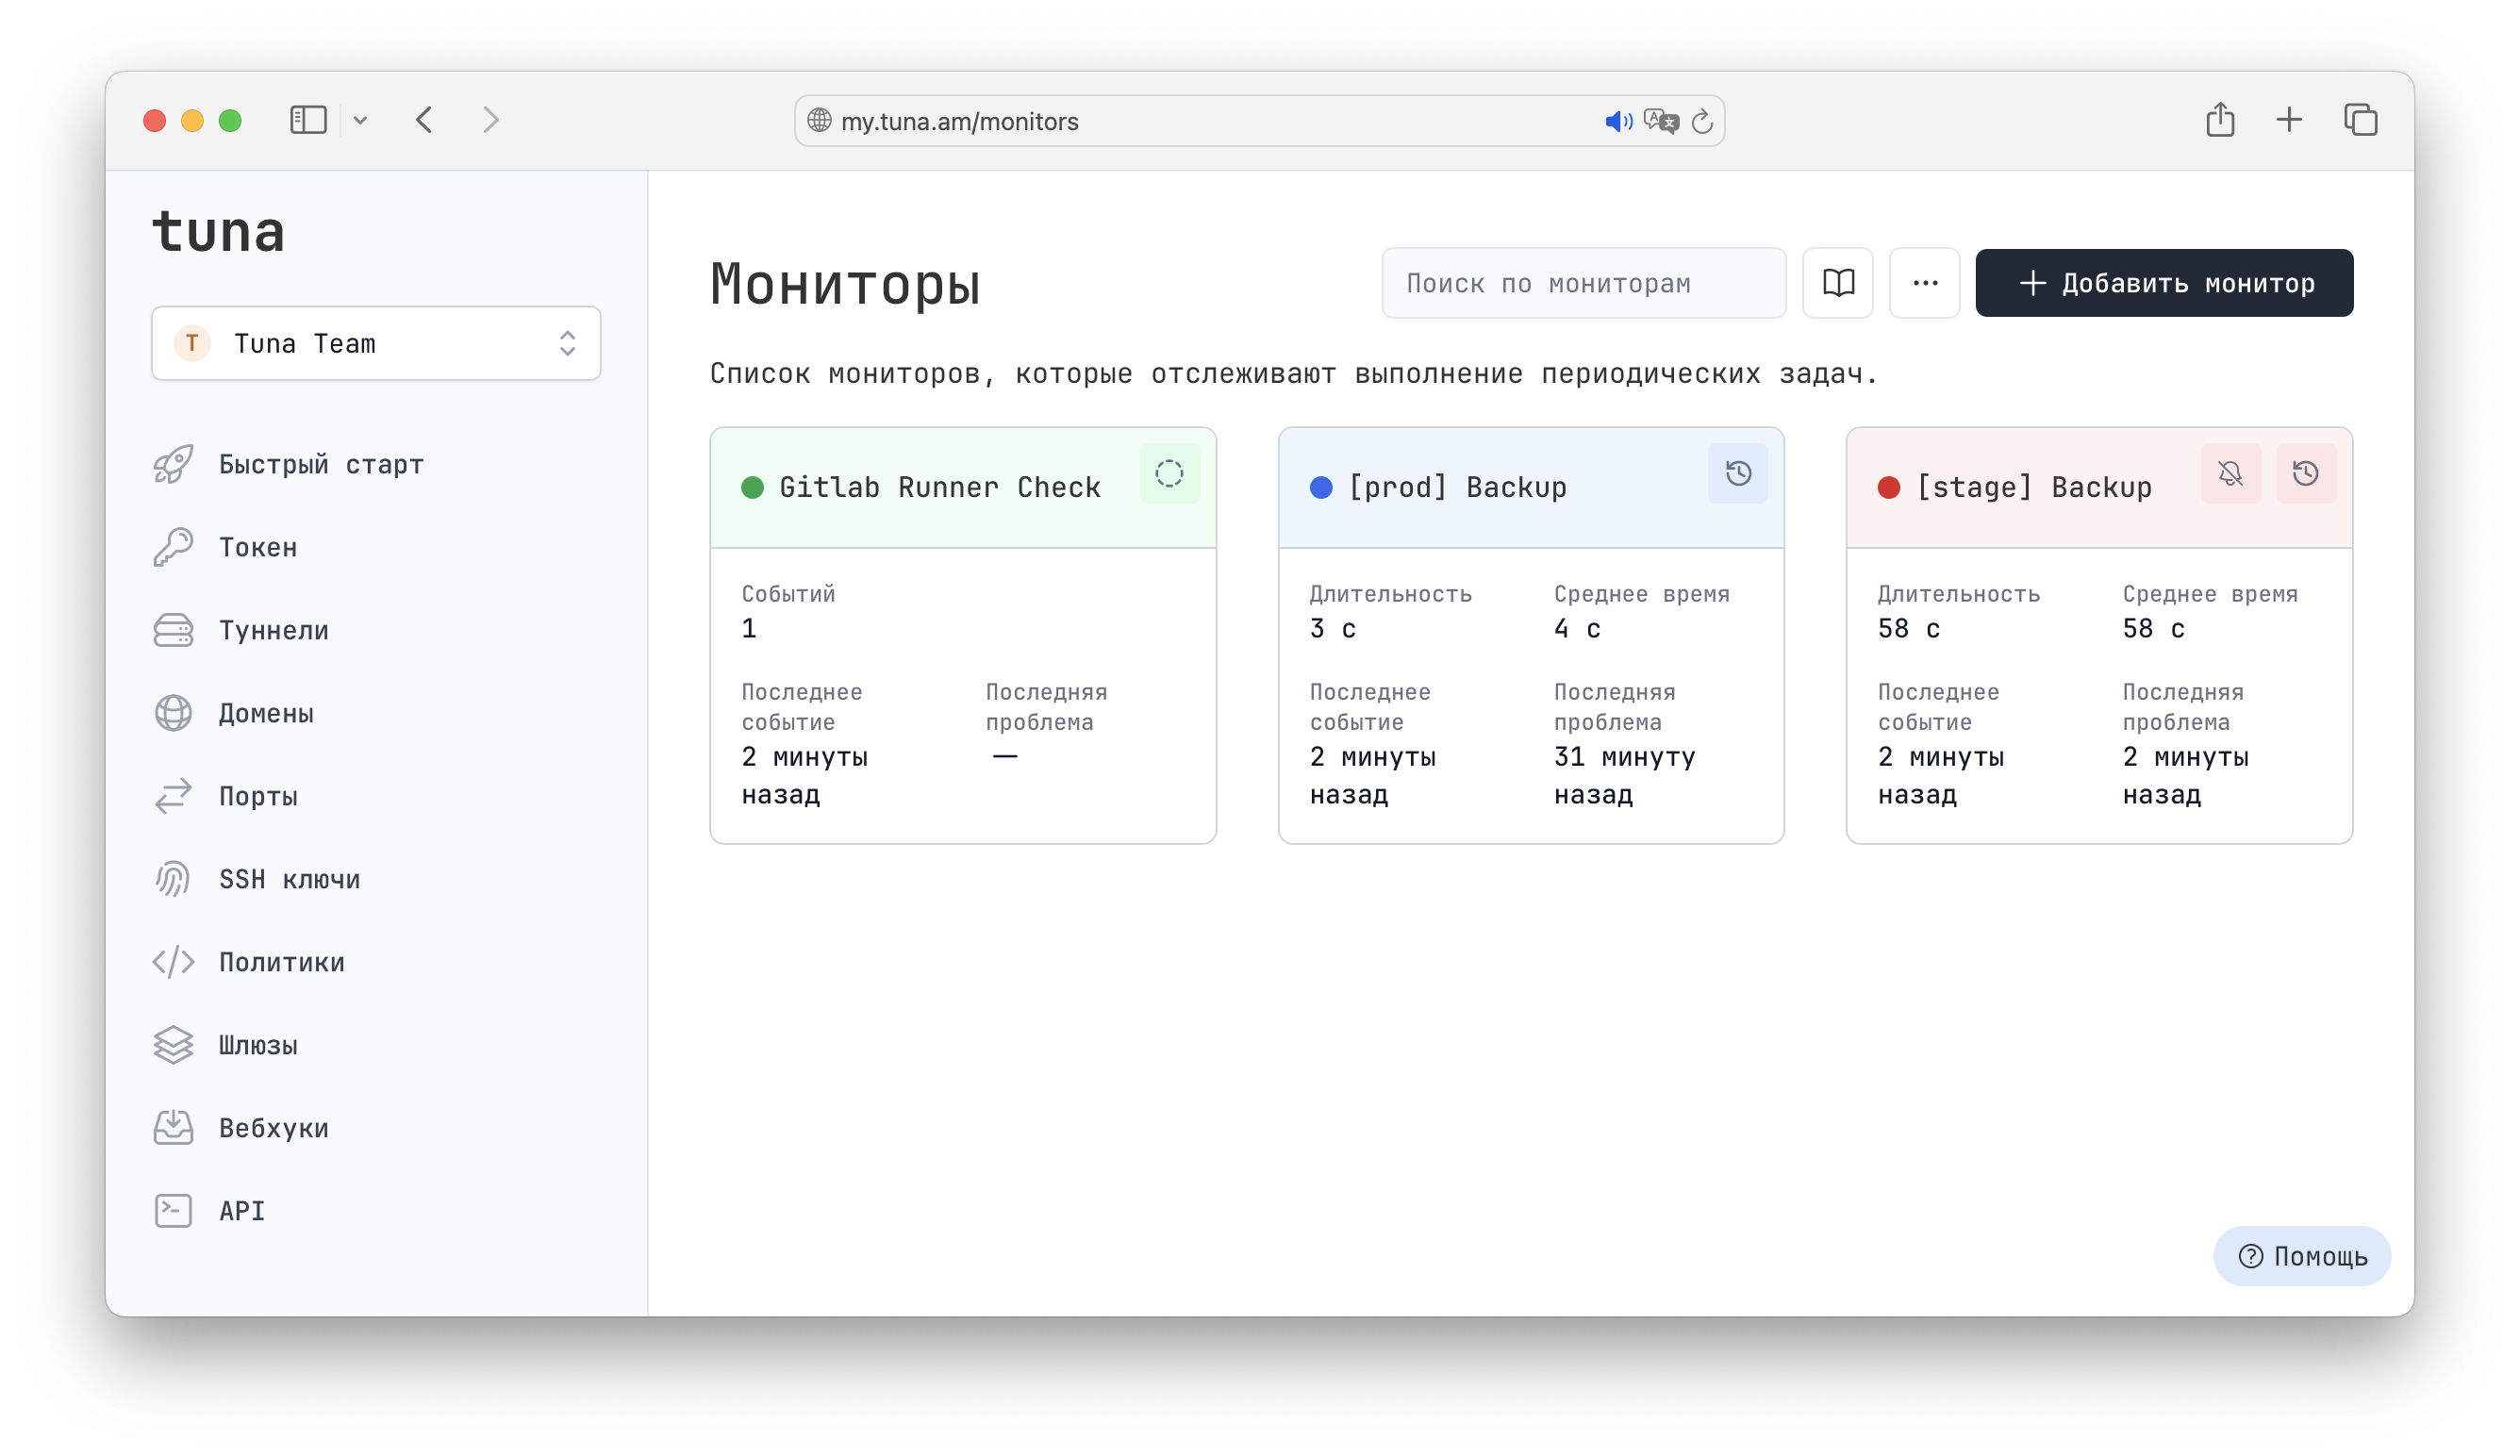
Overview
Monitors let you track the health of your services, jobs and infrastructure. When problems occur, you get notifications through the channels you have configured.
Monitor types
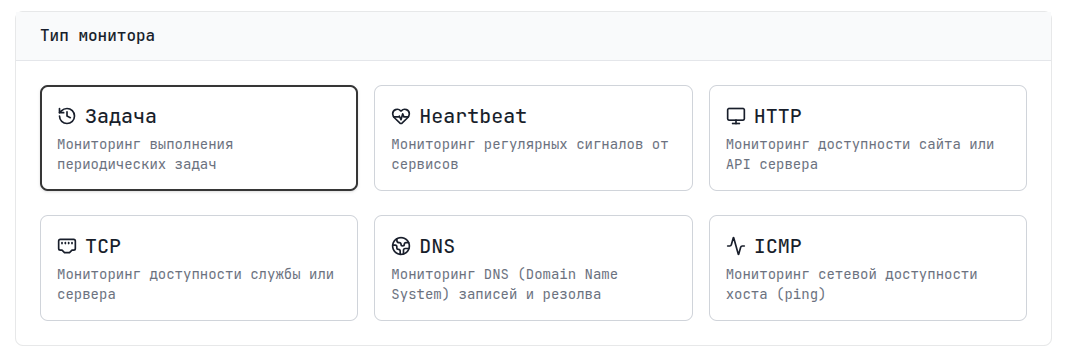
Tuna supports 6 monitor types, split into two categories:
User-driven monitors
These monitors wait for signals from your applications and scripts:
| Type | Description | Use case |
|---|---|---|
| Job | Monitors execution of periodic jobs | Backup scripts, cron jobs, scheduled operations |
| Heartbeat | Monitors regular signals from services | Services in closed networks, IoT devices, background processes |
External monitors
These monitors check the availability of your resources from multiple regions on their own:
| Type | Description | Use case |
|---|---|---|
| HTTP | Checks availability of websites and APIs | Websites, REST APIs, webhooks |
| TCP | Checks availability of TCP services | Databases, mail servers, game servers |
| DNS | Checks DNS records | Domains, MX records, TXT records |
| ICMP | Checks network reachability (ping) | Servers, network equipment |
Monitor statuses
Each monitor can be in one of the following states:
| Status | Description |
|---|---|
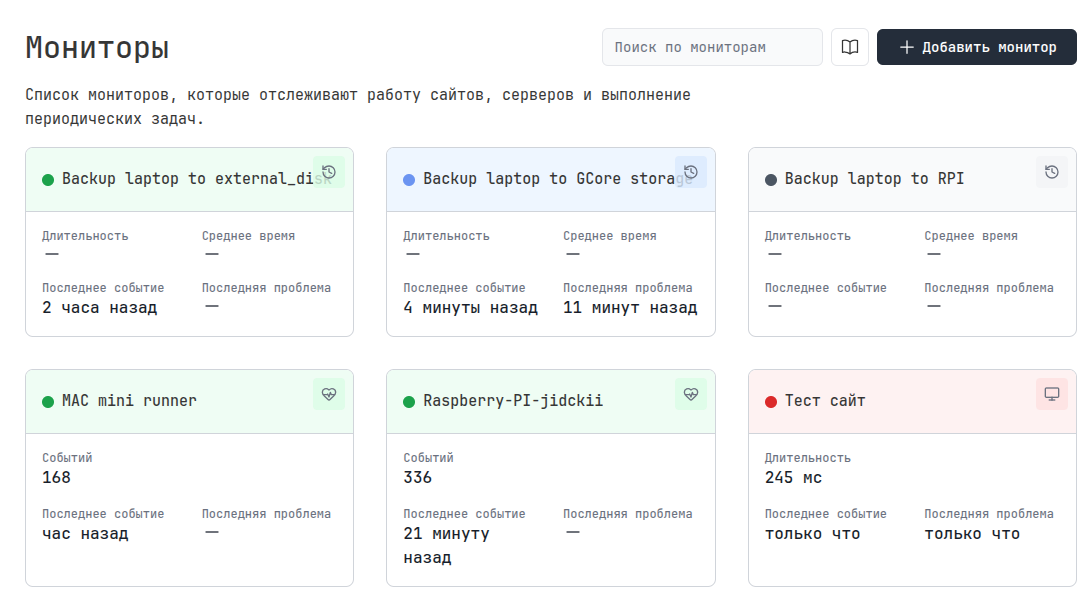
| ⚪ New | New monitor, not checked yet |
| 🟢 Up | Working normally |
| 🔵 Running | Running (for Job/Heartbeat) |
| 🔴 Down | Failed/unavailable |
Creating a monitor
- Go to the Monitors page
- Click Create monitor
- Select the monitor type
- Fill in the monitor parameters
- Configure notifications (optional)
- Save the monitor
For all monitor types there are common settings: Description and Notifications. But Details and Checks differ depending on the monitor type. See the dedicated page for more details on each type.
Notifications
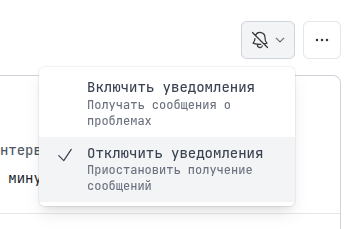
Monitors are integrated with the notification system through Contacts and Integrations. If no specific contact groups are specified, notifications are sent to the user's email. You can also disable notifications for a monitor.
Viewing a monitor
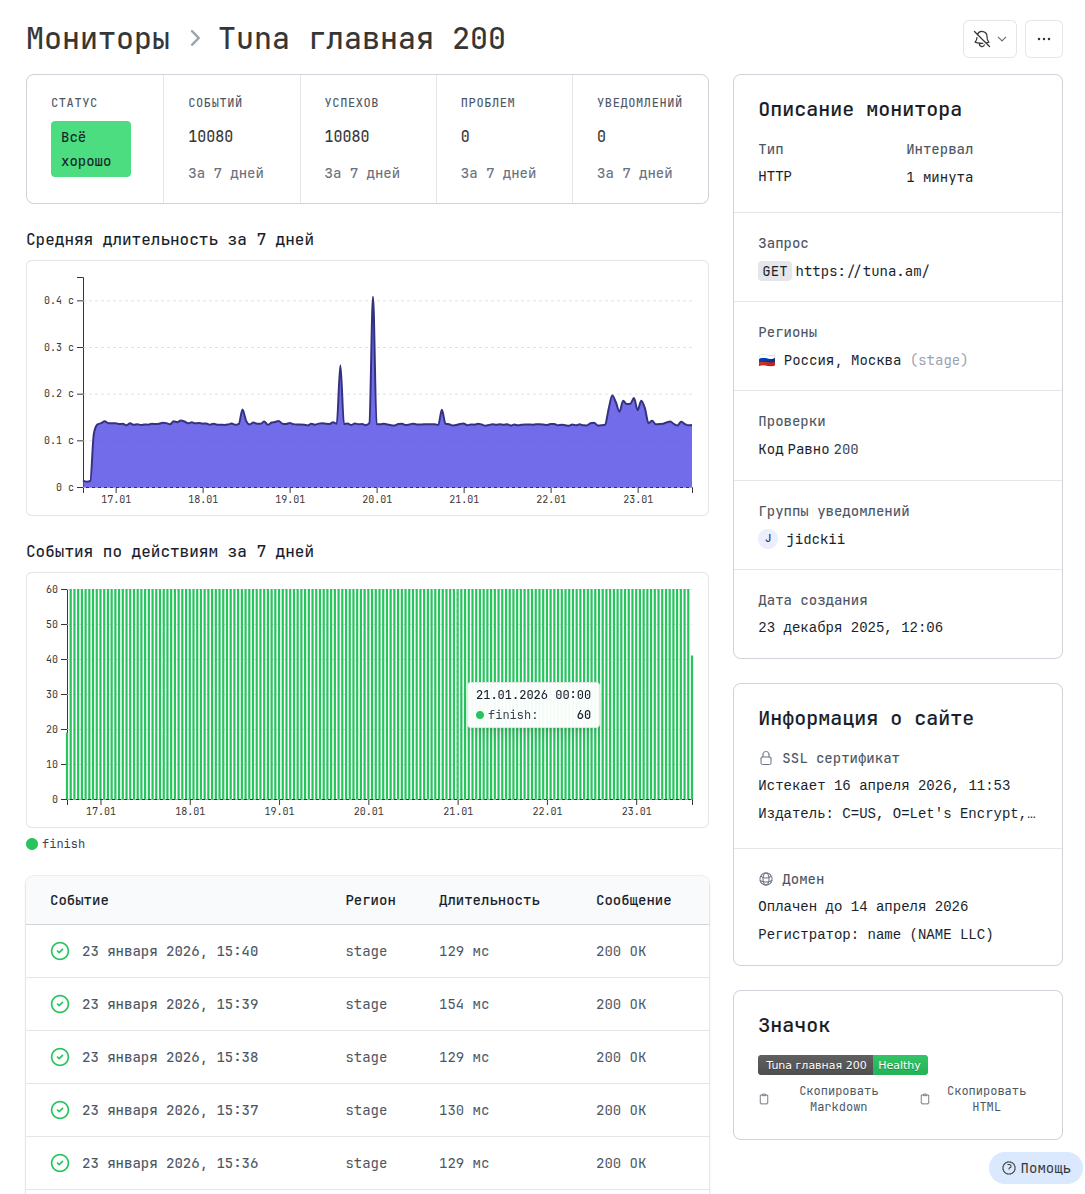
The monitor details page shows a lot of information. The data may differ depending on the monitor type.
Management
- Enable/Disable notifications for the monitor
- Edit — change monitor parameters
- Delete — delete the monitor
Regions and check interval
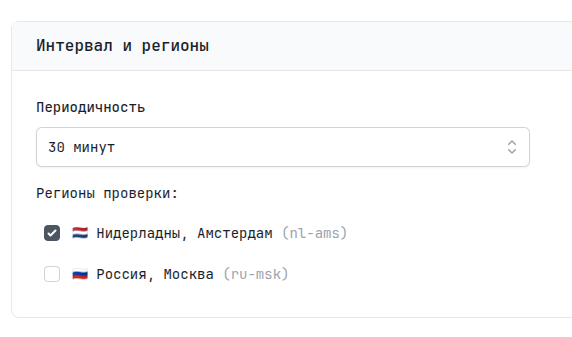
External monitors (HTTP, TCP, DNS, ICMP) can be checked from multiple geographic regions. When creating an external monitor you can choose one or several check regions. You also specify how often the resource availability check should run — the interval.
Working from the CLI
For Job and Heartbeat monitors you can use the tuna console client.
See more: Working with monitors in the CLI
Monitor types
6 items
Status pages
Public pages with the status of your services based on Tuna monitors
Working from the CLI
Managing monitors through the tuna console client
Examples
2 items