# Reports
[Go to personal account](https://my.tuna.am/reports)
Functionality for collecting errors and creating comprehensive reports on your website.

***
## Overview
Using an embeddable script, users and QA engineers can easily show where the bug is hiding, and you can get debug information and immediately start fixing it.
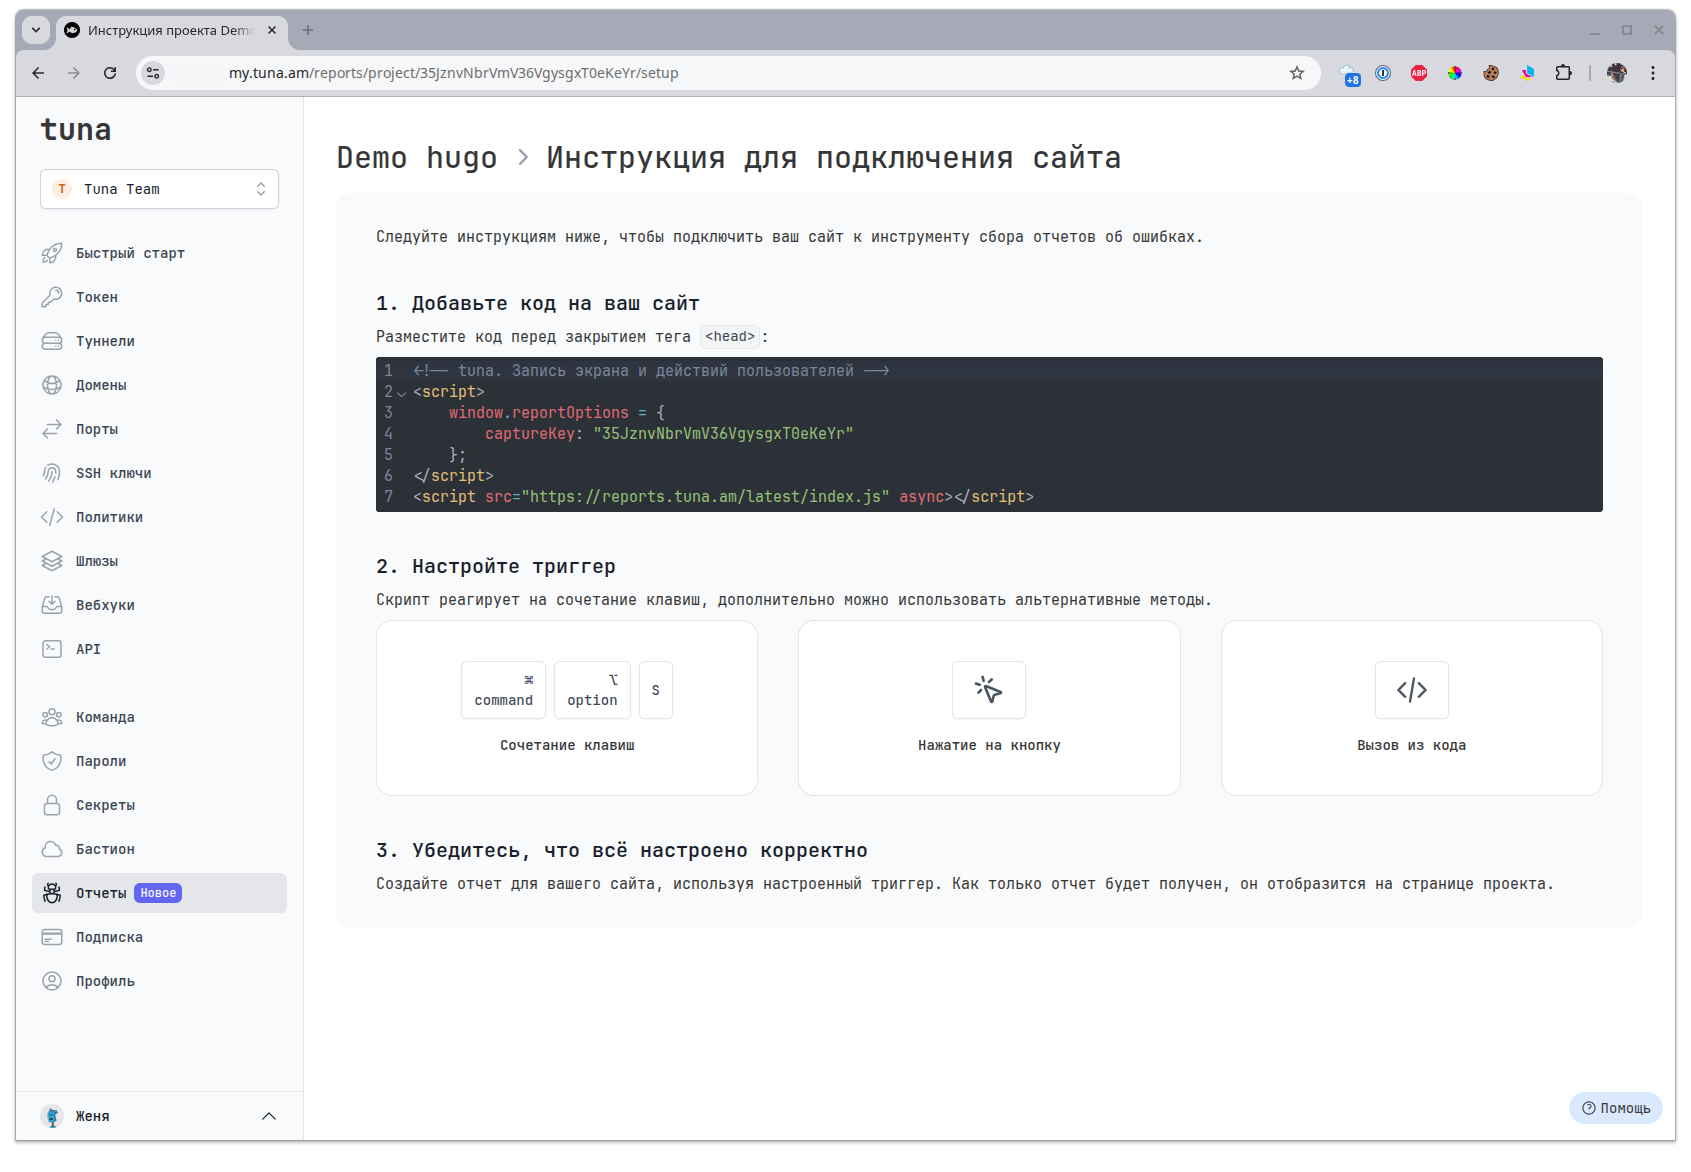
To do this, create a project and connect the script to your site.
## Service structure
Inside the **Reports** service there are **Projects**, it is assumed that you create a separate project for each of your sites. Projects are separated by a unique `captureKey`. Inside projects, reports you create with screenshots and video recordings will appear.
## Installation
Place the code on the HTML page before the closing `` tag:
```html
```
Replace **YOUR_CAPTURE_KEY** with yours from the desired project.
## Calling the script to create a report
There are several ways to create a report:
* Hotkeys
* Button (data attribute)
* Call from code (JS)
* URL argument
### Hotkeys
**Windows**
Use the key combination
`CTRL` + `ALT` + `S`
**macOS**
Use the key combination
`⌘ command` + `⌥ option` + `S`
**Linux**
Use the key combination
`CTRL` + `ALT` + `S`
### Button click
Call the report creation form by adding a button with a data attribute:
```html
```
### Call from code
Call the report creation form from your code by adding the command:
```js
if (typeof window.autoCapture !== 'undefined'
&& window.autoCapture.showCaptureModal) {
window.autoCapture.showCaptureModal();
}
```
### URL argument
Call the report creation form by adding the argument `report=true` to the URL in the address bar.
```url
https://example.com/dashboard?report=true
```
## Request to create a report with screen recording
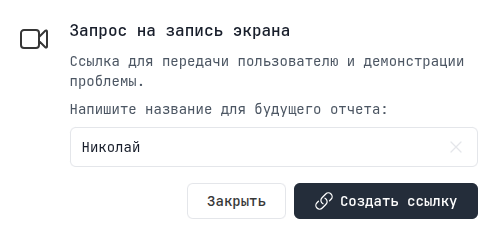
If you want the user to record a report for you not from the site, but to demonstrate the problem on their workstation, then you can create a link with a request for screen recording.
***
By following the link, the user will be able to record a video for you and tell you about the problem.

## What does a report look like?
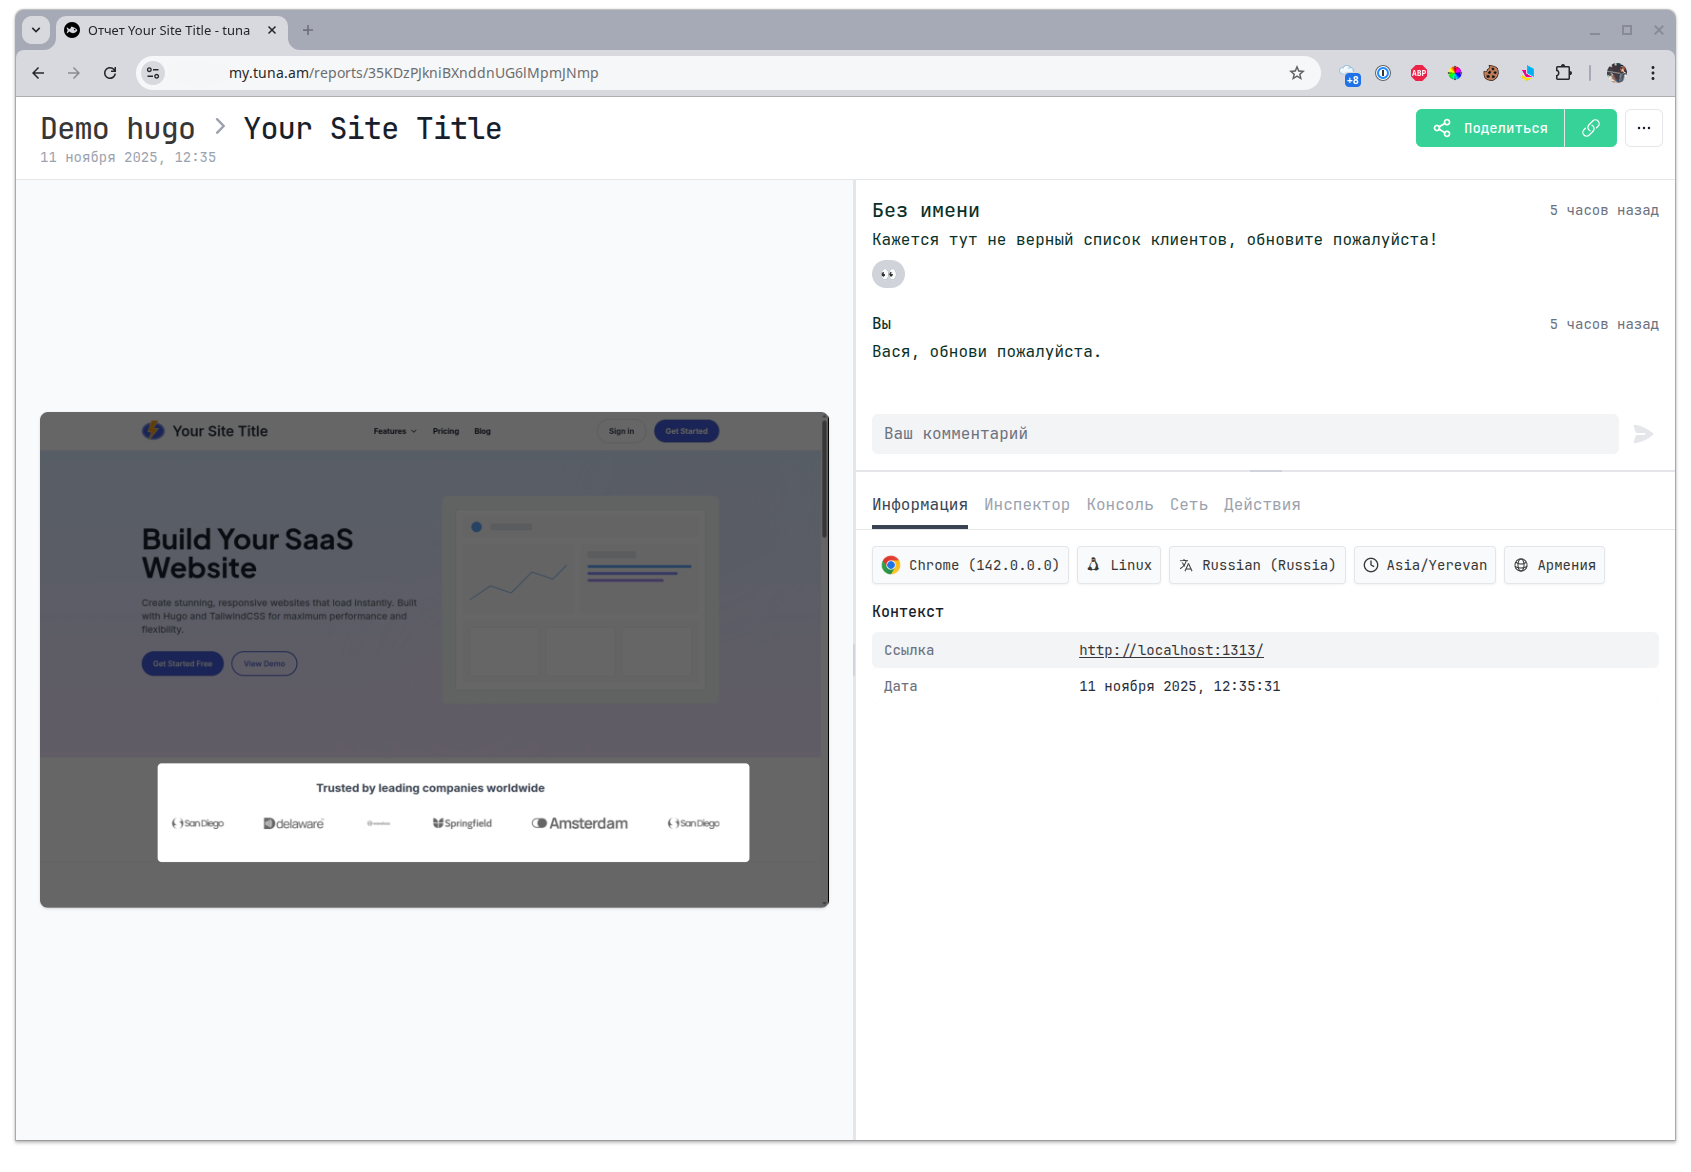
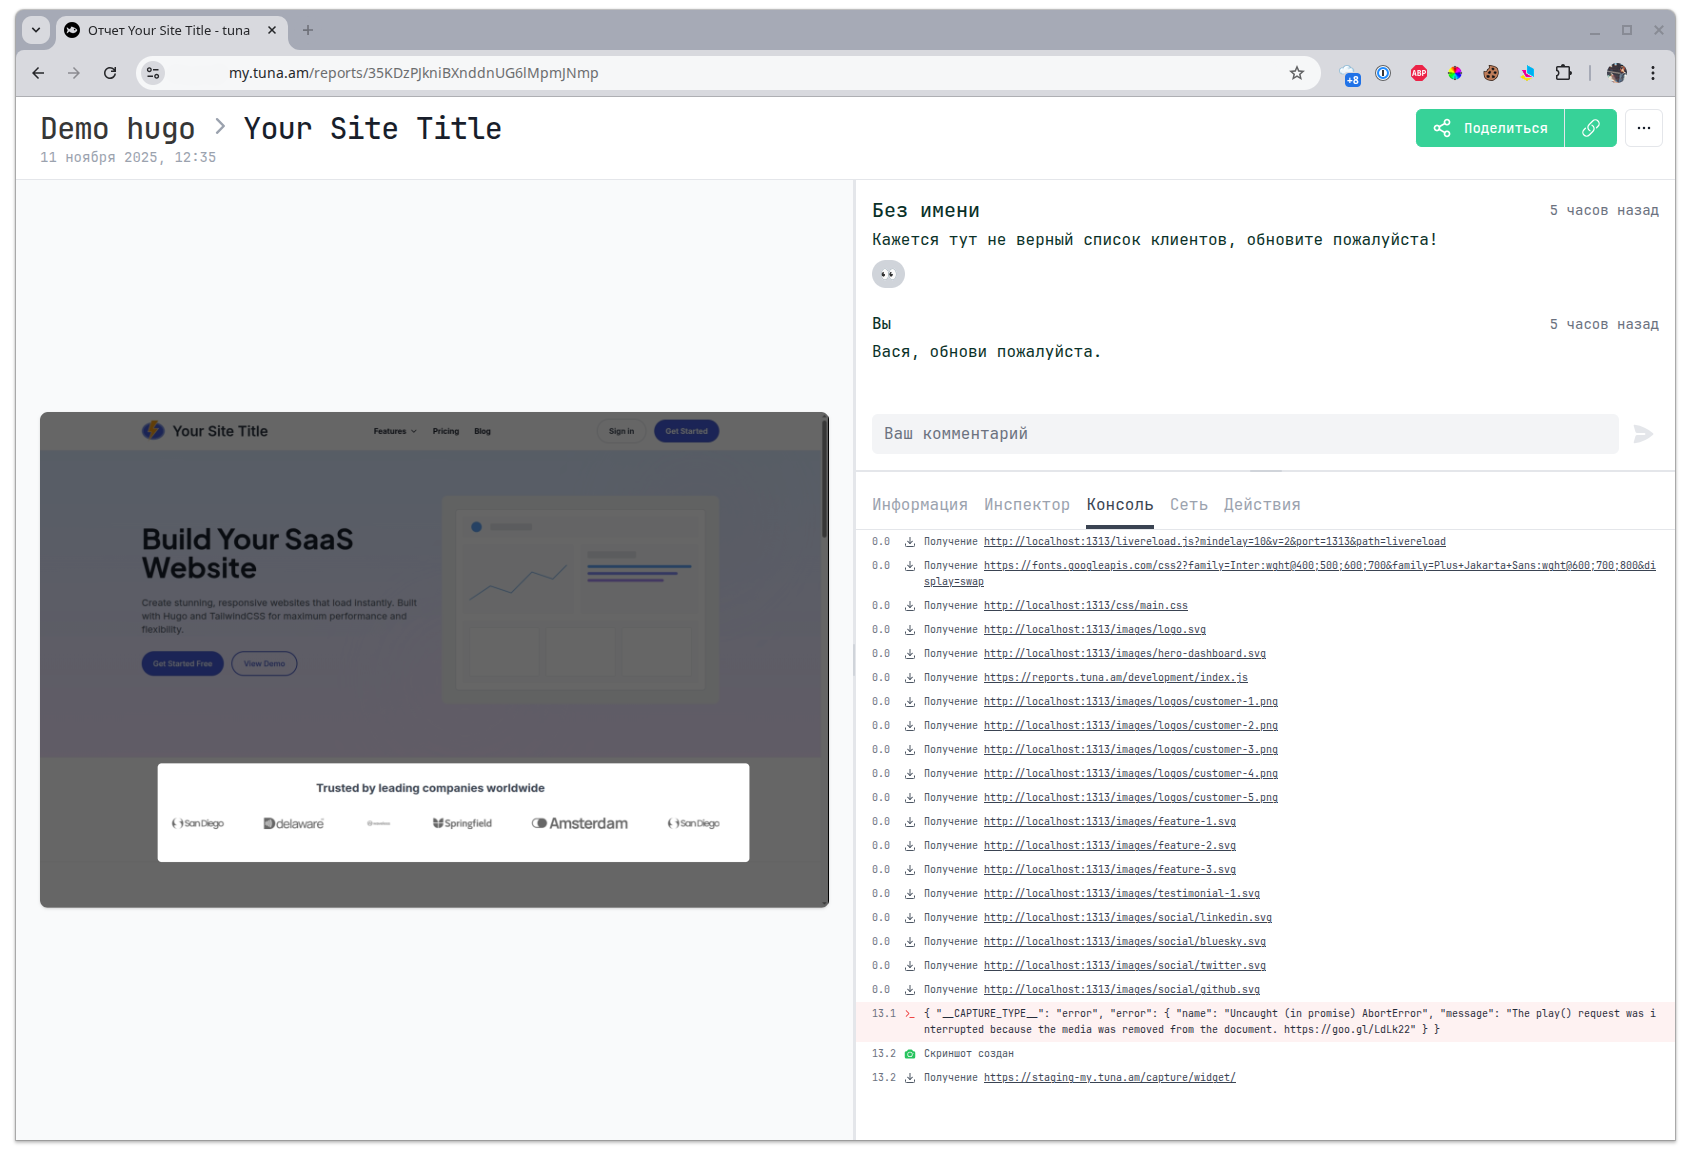
Inside the report you will find a screenshot or video and all the debugging information from the console, network operations, user actions and a snapshot of the page DOM tree.
**Info**
The first tab contains general summary information about the client, device and browser.
**Inspector**
A snapshot of the page DOM tree, with the ability to select an element.
***
note
This tab is only available for reports with a screenshot. Reports with video cannot capture a DOM tree snapshot since it can change over time.
**Console**
A list of all events from the browser console.
**Network**
A list of all XHR requests with the option to look into the details.
**Actions**
User actions on the page.

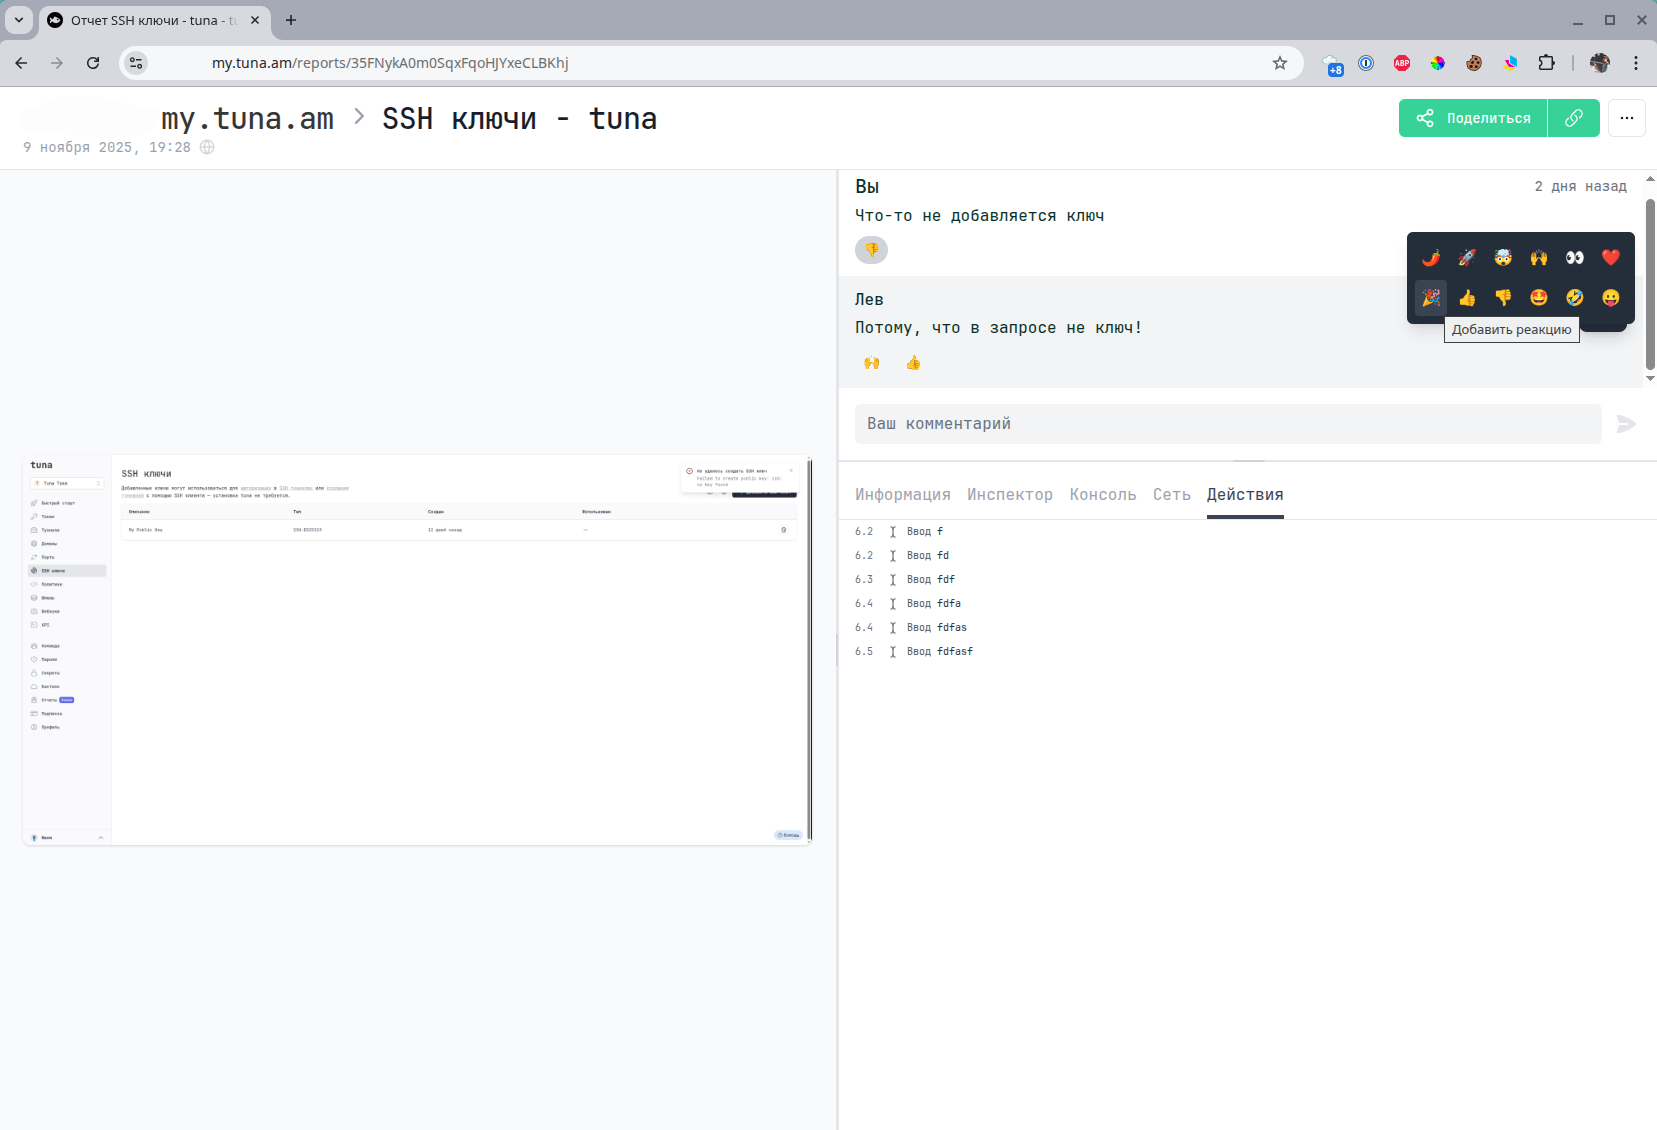
**Comments**
You can also leave comments and reactions to comments.
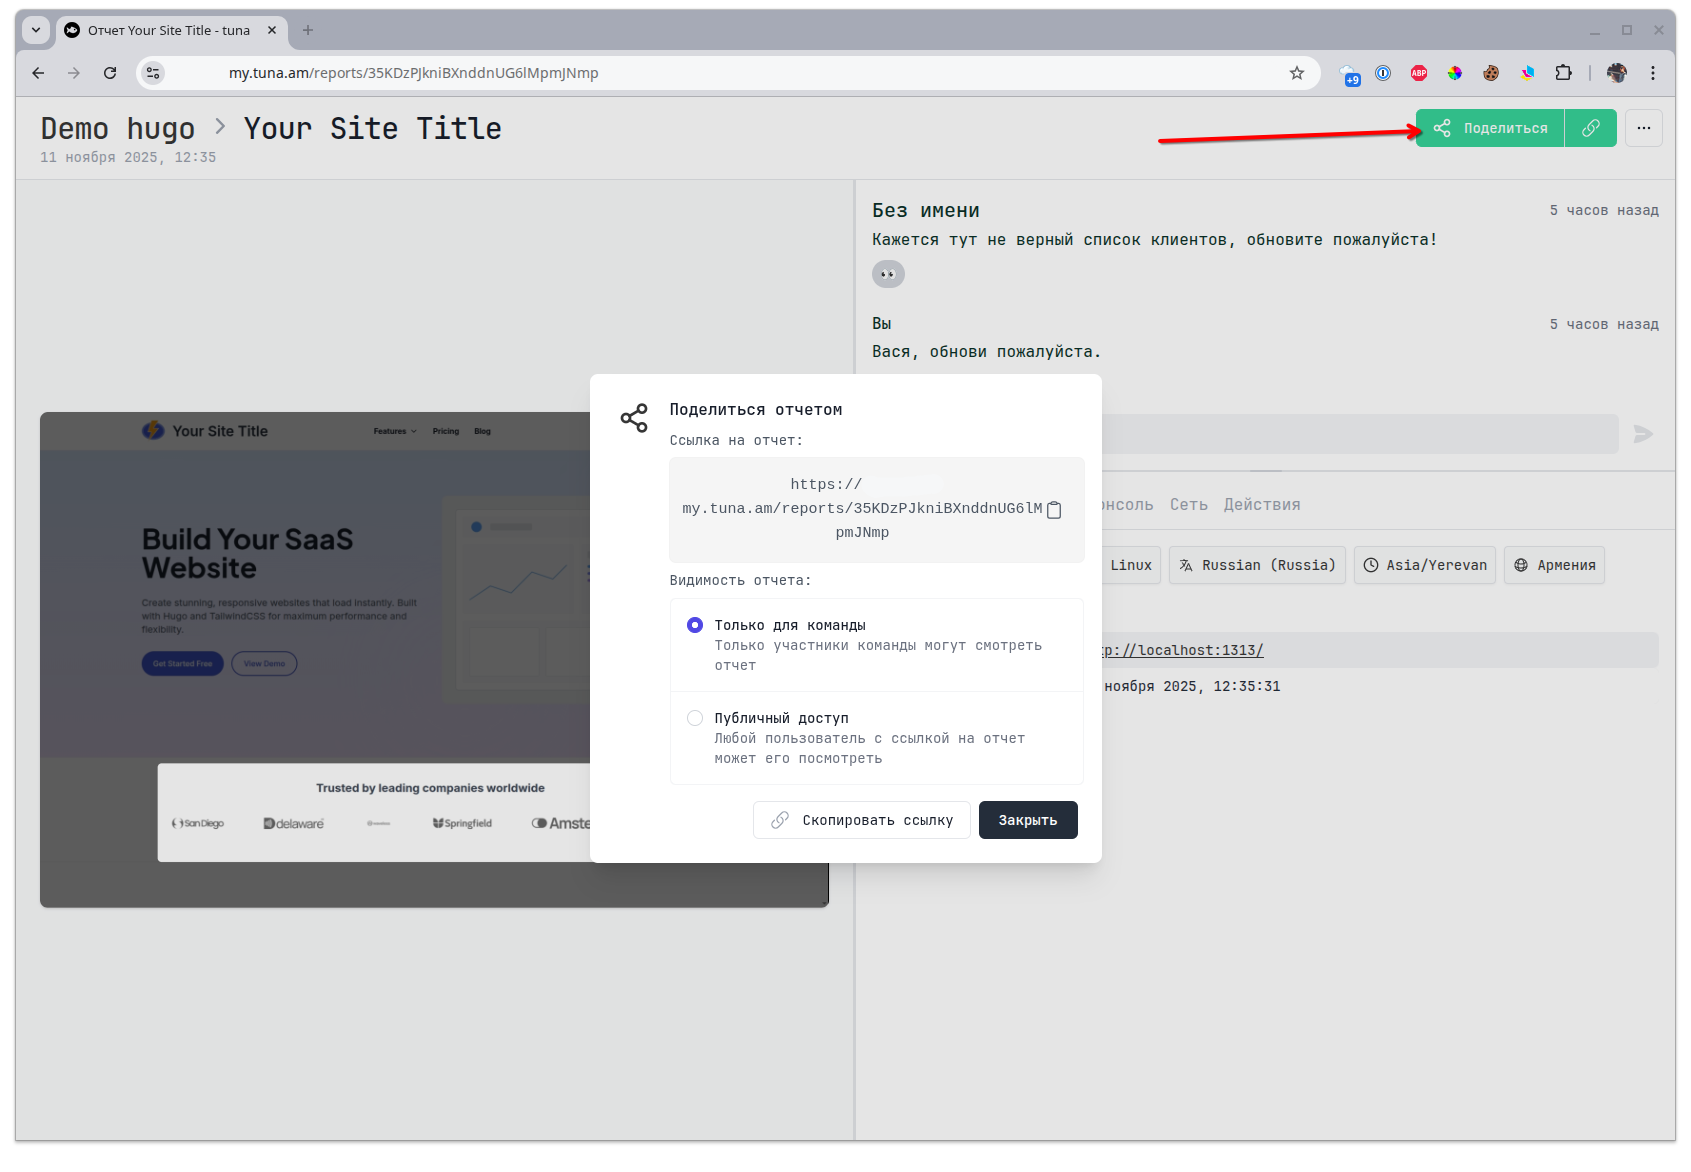
## Report visibility
By default, a report is created with visibility - **For team members only**, but you can make it public. For example, to conduct a dialogue with a client who created a report.