Inspector
Overview
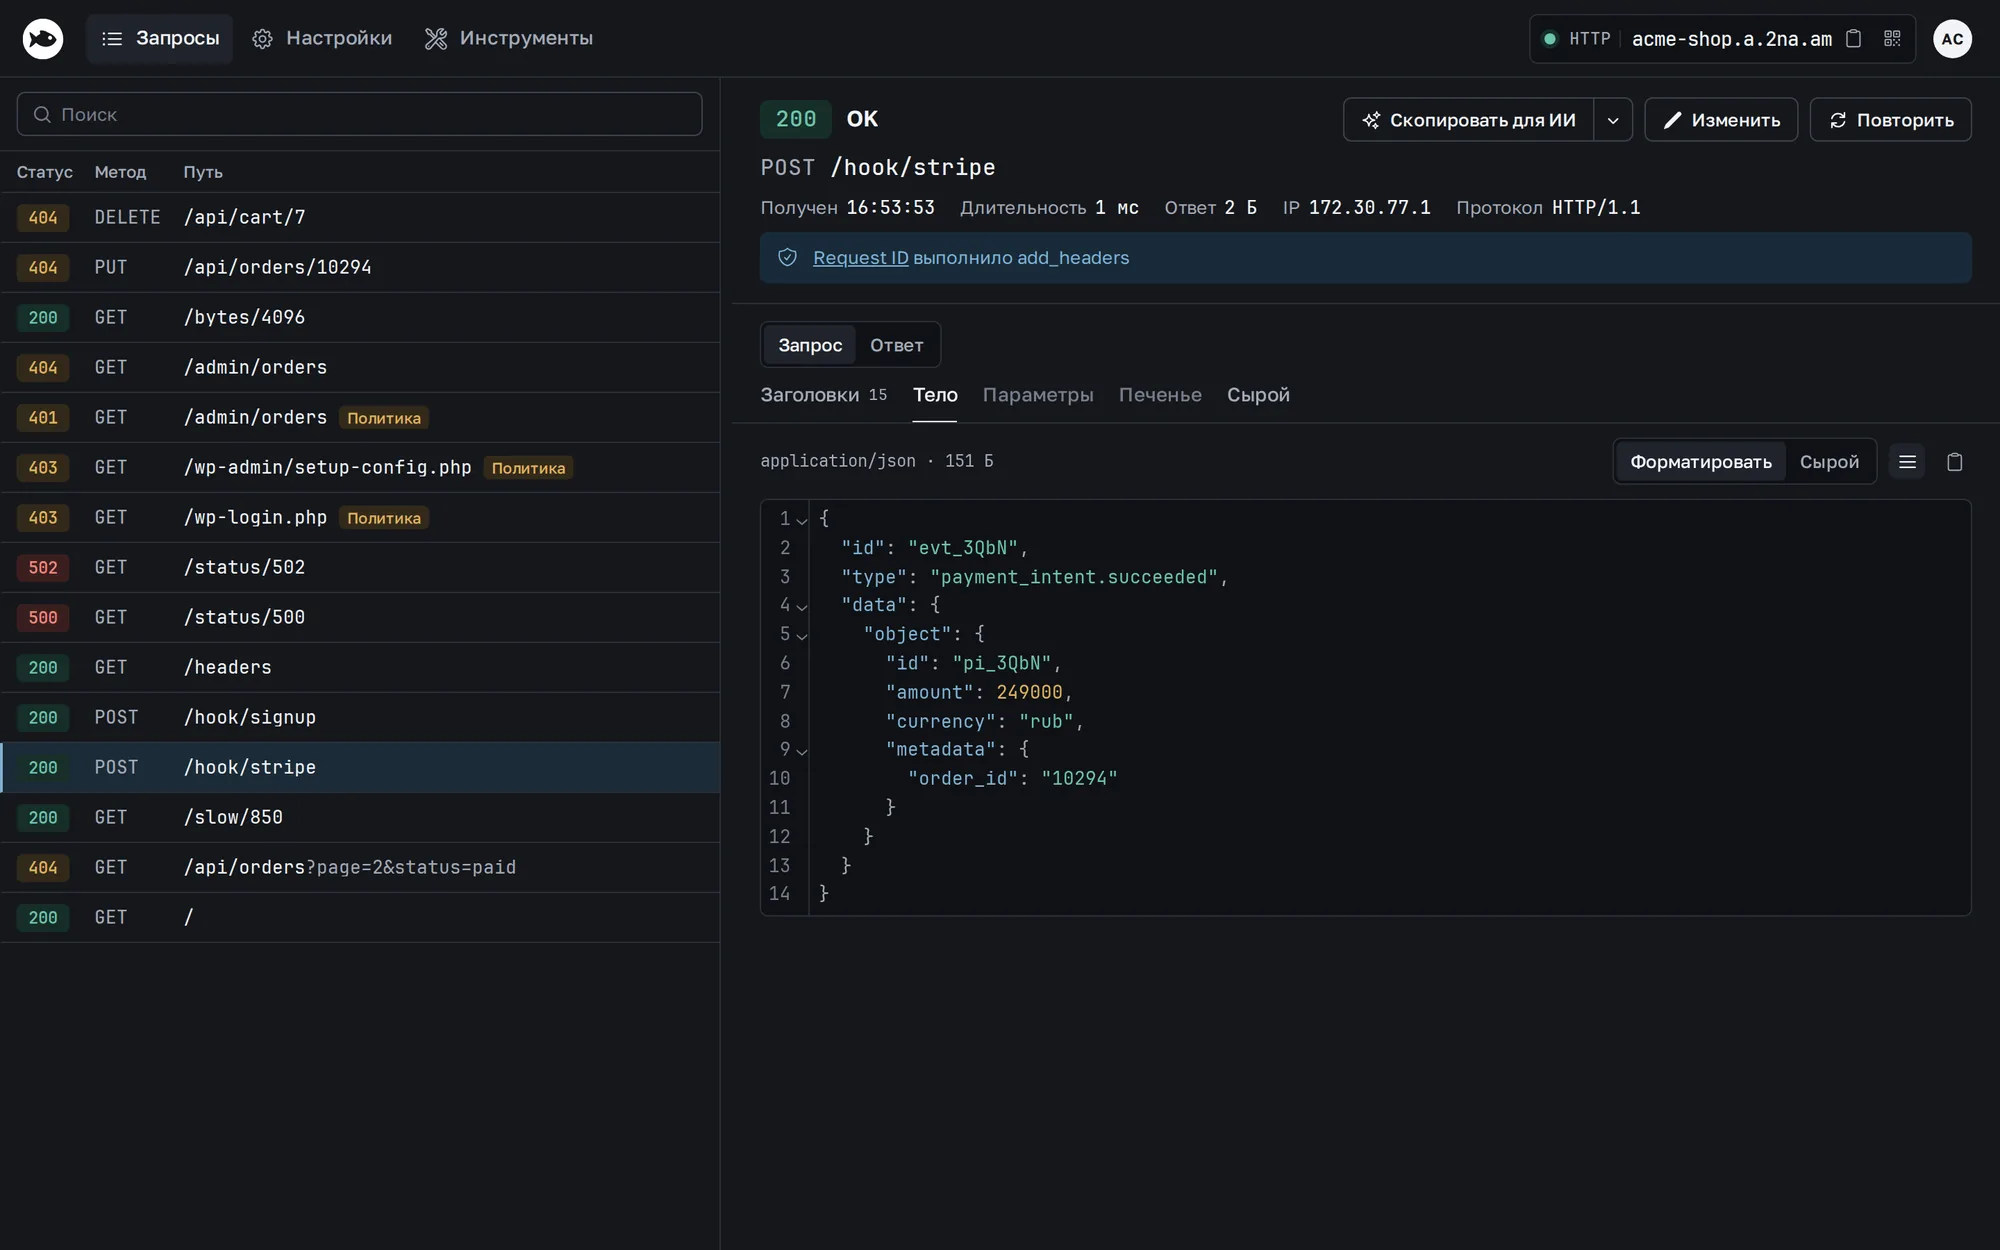
The inspector shows everything that went through a tunnel in your browser: HTTP requests with headers and bodies, SQL queries, and Redis commands grouped by session. You can replay a request, with or without edits, and an AI agent can read the same data through the API.
These tunnels have an inspector:
| Command | Default | What you see |
|---|---|---|
tuna http | on | HTTP requests and responses |
tuna 1c | on | requests to the 1C publication |
tuna kubernetes | on | guest requests to the cluster API |
tuna postgres | always | sessions and SQL queries |
tuna mysql | always | sessions and SQL queries |
tuna redis | always | sessions and commands |
The CLI logs the inspector address as Web Interface: http://127.0.0.1:4040 and shows it in the header of the terminal UI. Press i to open it in a browser. Recent requests are also visible right in the terminal:
Startup and port
The first tunnel takes 127.0.0.1:4040, the next ones take 4041, 4042, and so on. Port 4045 is skipped because browsers block it.
To keep the address independent of the startup order, set the port explicitly:
tuna http 8080 --inspect-port=4100
TUNA_INSPECT_PORT=4100 tuna http 8080
If an explicitly set port is busy, the tunnel fails to start, and the error names whoever holds the port:
inspector port 4100 is used by tuna http (pid 81234, https://acme-shop.a.2na.am). Set another --inspect-port or unset TUNA_INSPECT_PORT
Turning it off
For tuna http, tuna 1c, and tuna kubernetes, turn the inspector off with --inspect=false or TUNA_INSPECT=false. Database tunnels always have it on; if you don't need it, use a TCP tunnel.
The inspector keeps up to 2048 entries in memory, capped at 256 MB, and evicts the oldest ones. You can clear the history in Settings. On servers and embedded devices (IP-KVM, Raspberry Pi) it is better to turn it off. In a service it is off by default; pass --inspect explicitly to enable it.
Several tunnels
In tuna start, each tunnel takes the next free port. Set a fixed port in commandLine:
tunnels:
  web:
    commandLine: tuna http 5173 --subdomain=web --inspect-port=4100
  api:
    commandLine: tuna http 8080 --subdomain=api --inspect-port=4101
When several tunnels start, TUNA_INSPECT_PORT sets the start of the range: the first tunnel gets this port, the rest get the following ones.
Network access
By default the inspector listens on 127.0.0.1 only. To open it to other machines, use TUNA_INSPECT_ADDR:
TUNA_INSPECT_ADDR=0.0.0.0 tuna http 8080
Anyone who can reach the inspector address can read and replay requests: tokens, cookies, and bodies are not masked. When the address is not loopback, the CLI logs a warning and the inspector shows a banner.
A port in TUNA_INSPECT_ADDR (0.0.0.0:4100) still works but is deprecated; use --inspect-port instead. The inspectAddr key in the configuration file is no longer read, and the CLI warns about it in the log.
Docker
In the yuccastream/tuna Docker image, the inspector of tuna http, tuna 1c, and tuna kubernetes is off. Turn it on with --inspect or TUNA_INSPECT=true. To reach it from outside the container, you also need TUNA_INSPECT_ADDR=0.0.0.0 and a published port:
services:
  tuna:
    image: yuccastream/tuna:latest
    command: http app:8080
    ports:
      - "127.0.0.1:4040:4040"
    environment:
      TUNA_API_KEY: tak_***
      TUNA_INSPECT: "true"
      TUNA_INSPECT_ADDR: 0.0.0.0
Previously, TUNA_INSPECT_ADDR was enough in Docker. Now the inspector won't start without TUNA_INSPECT=true.
HTTP
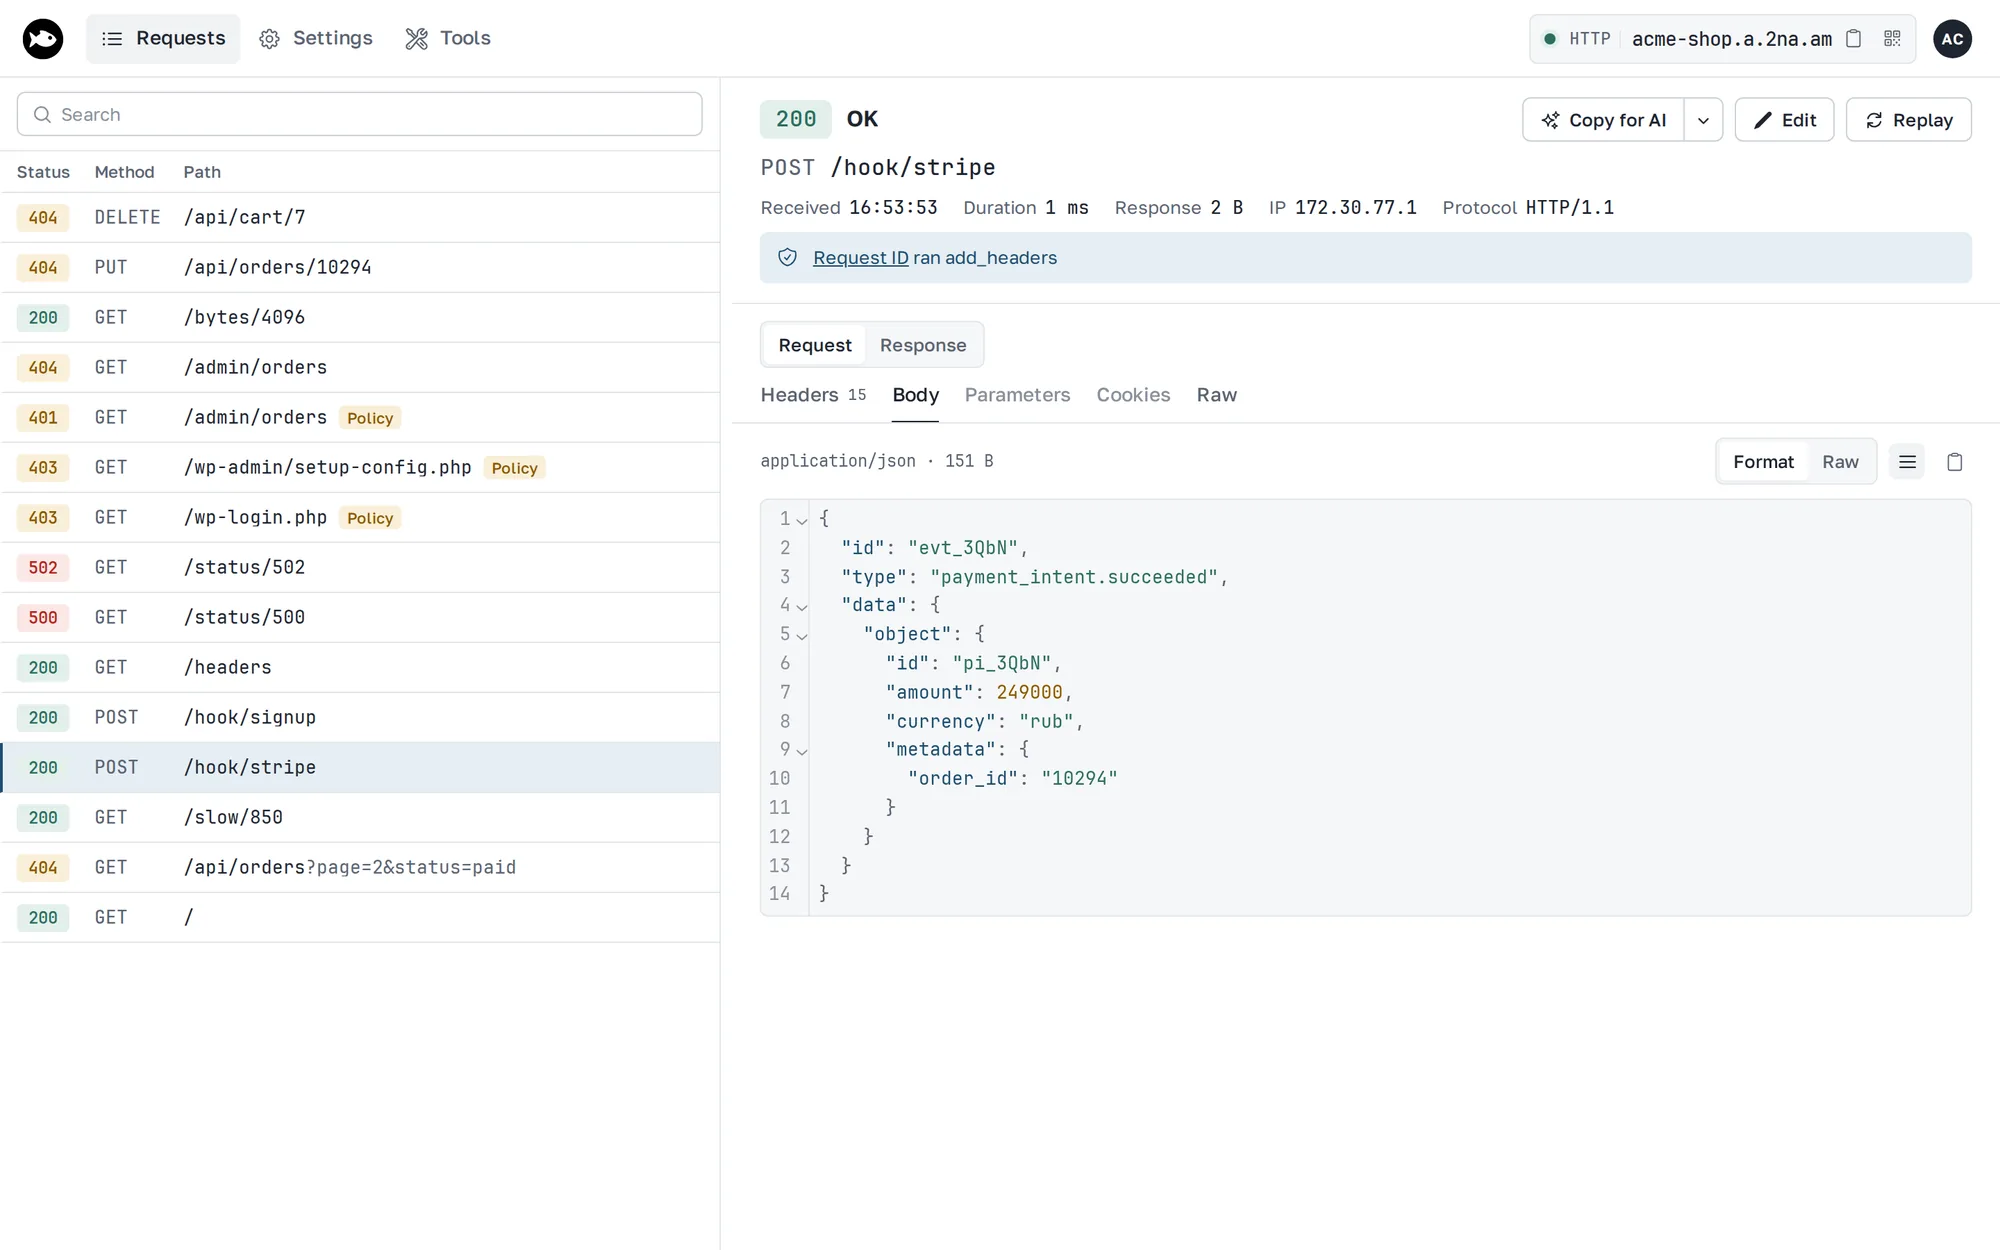
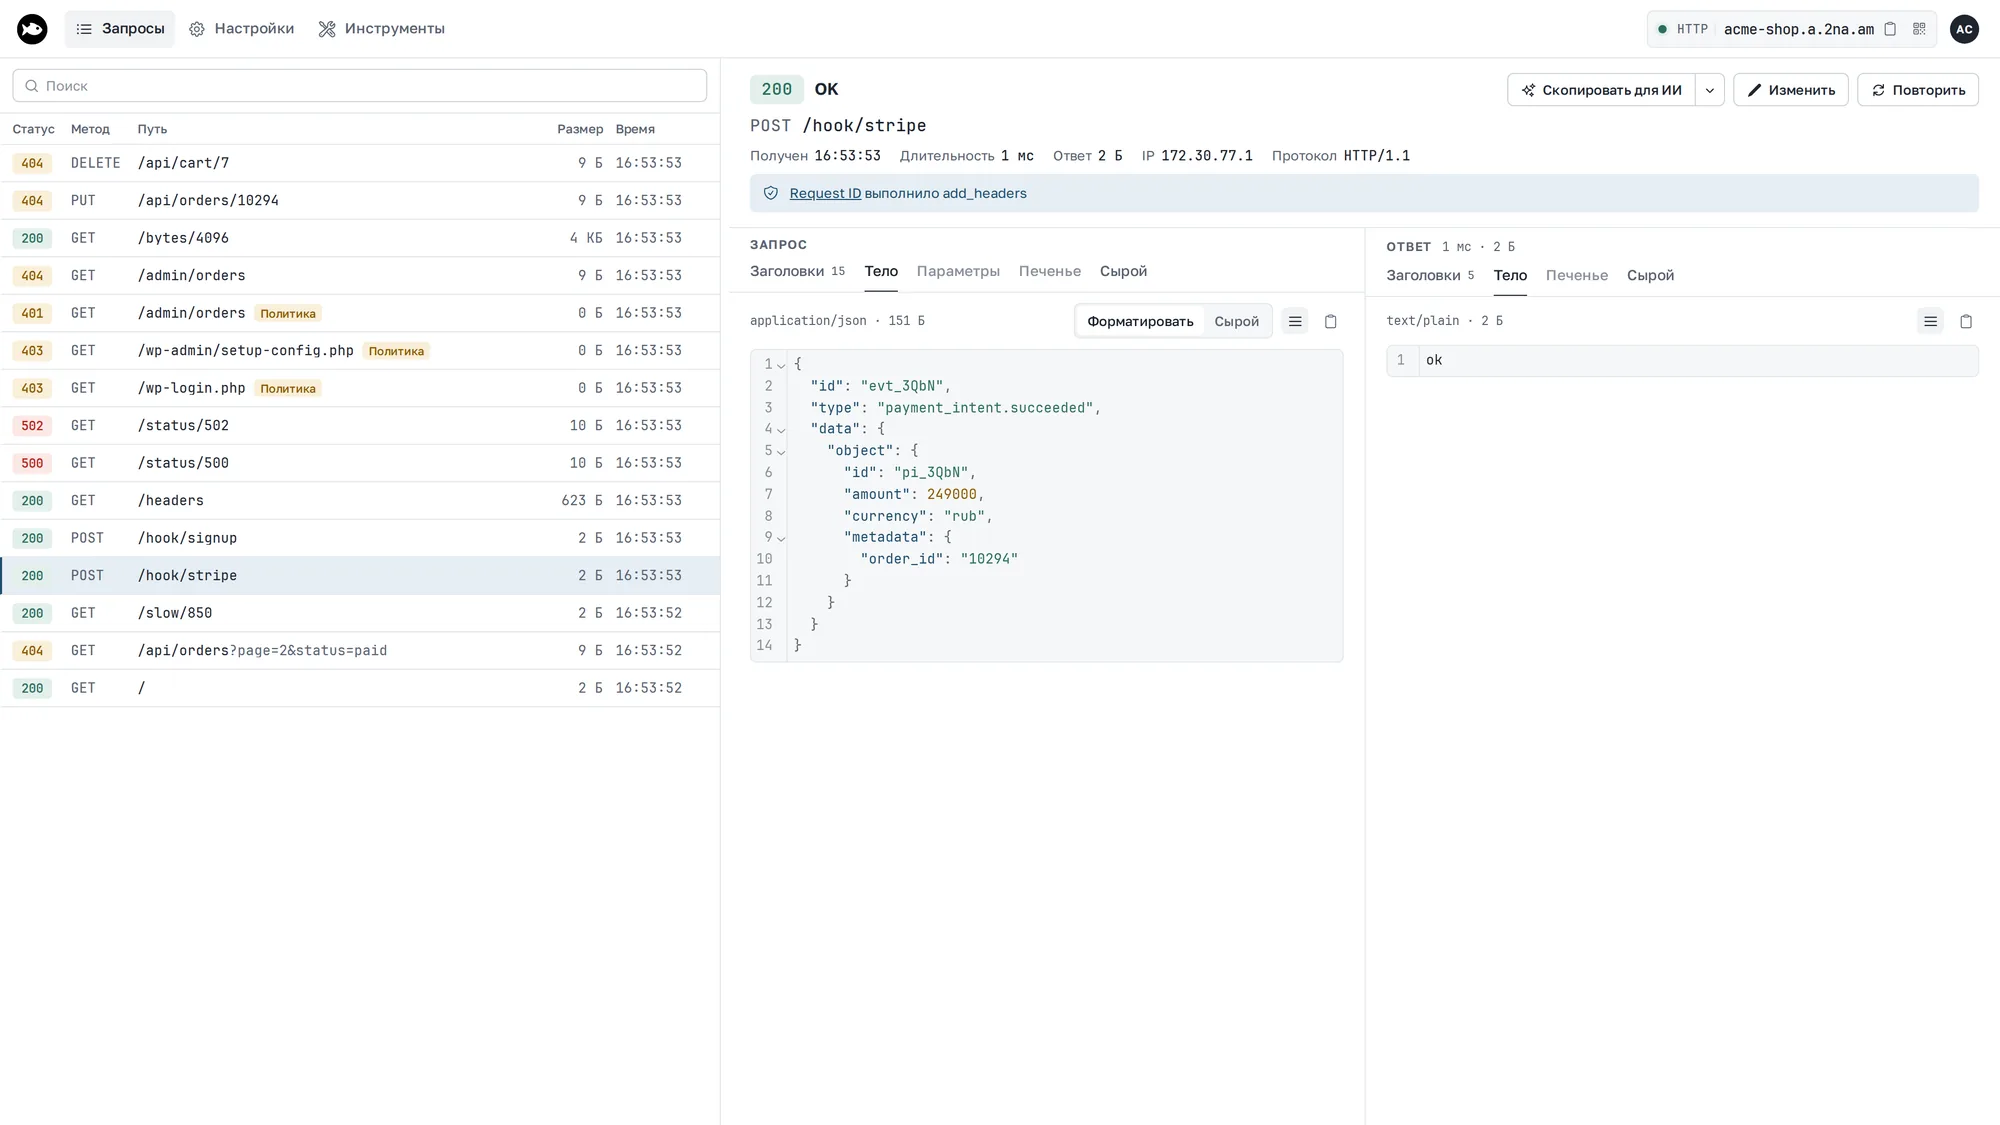
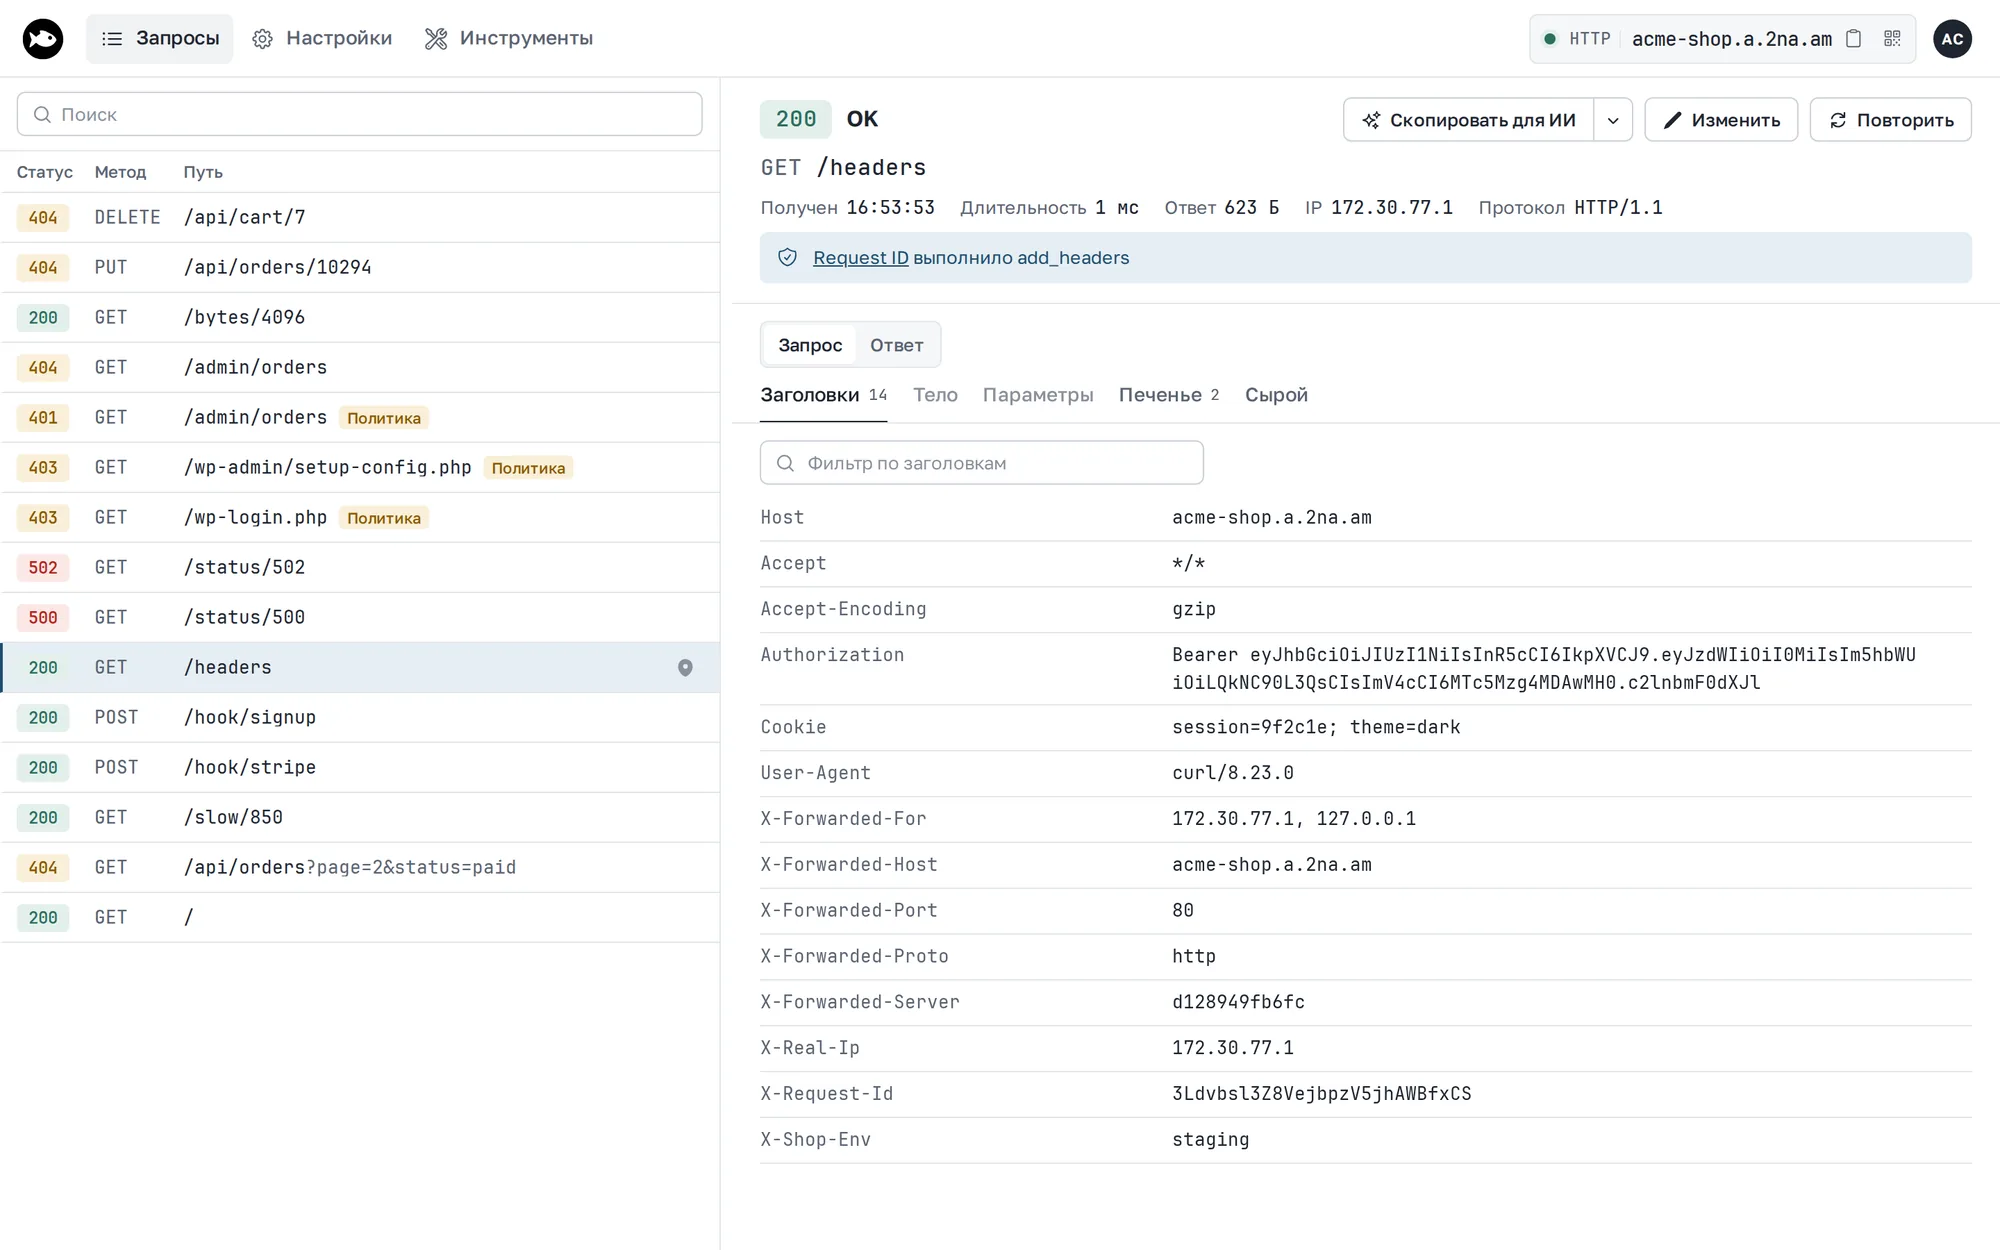
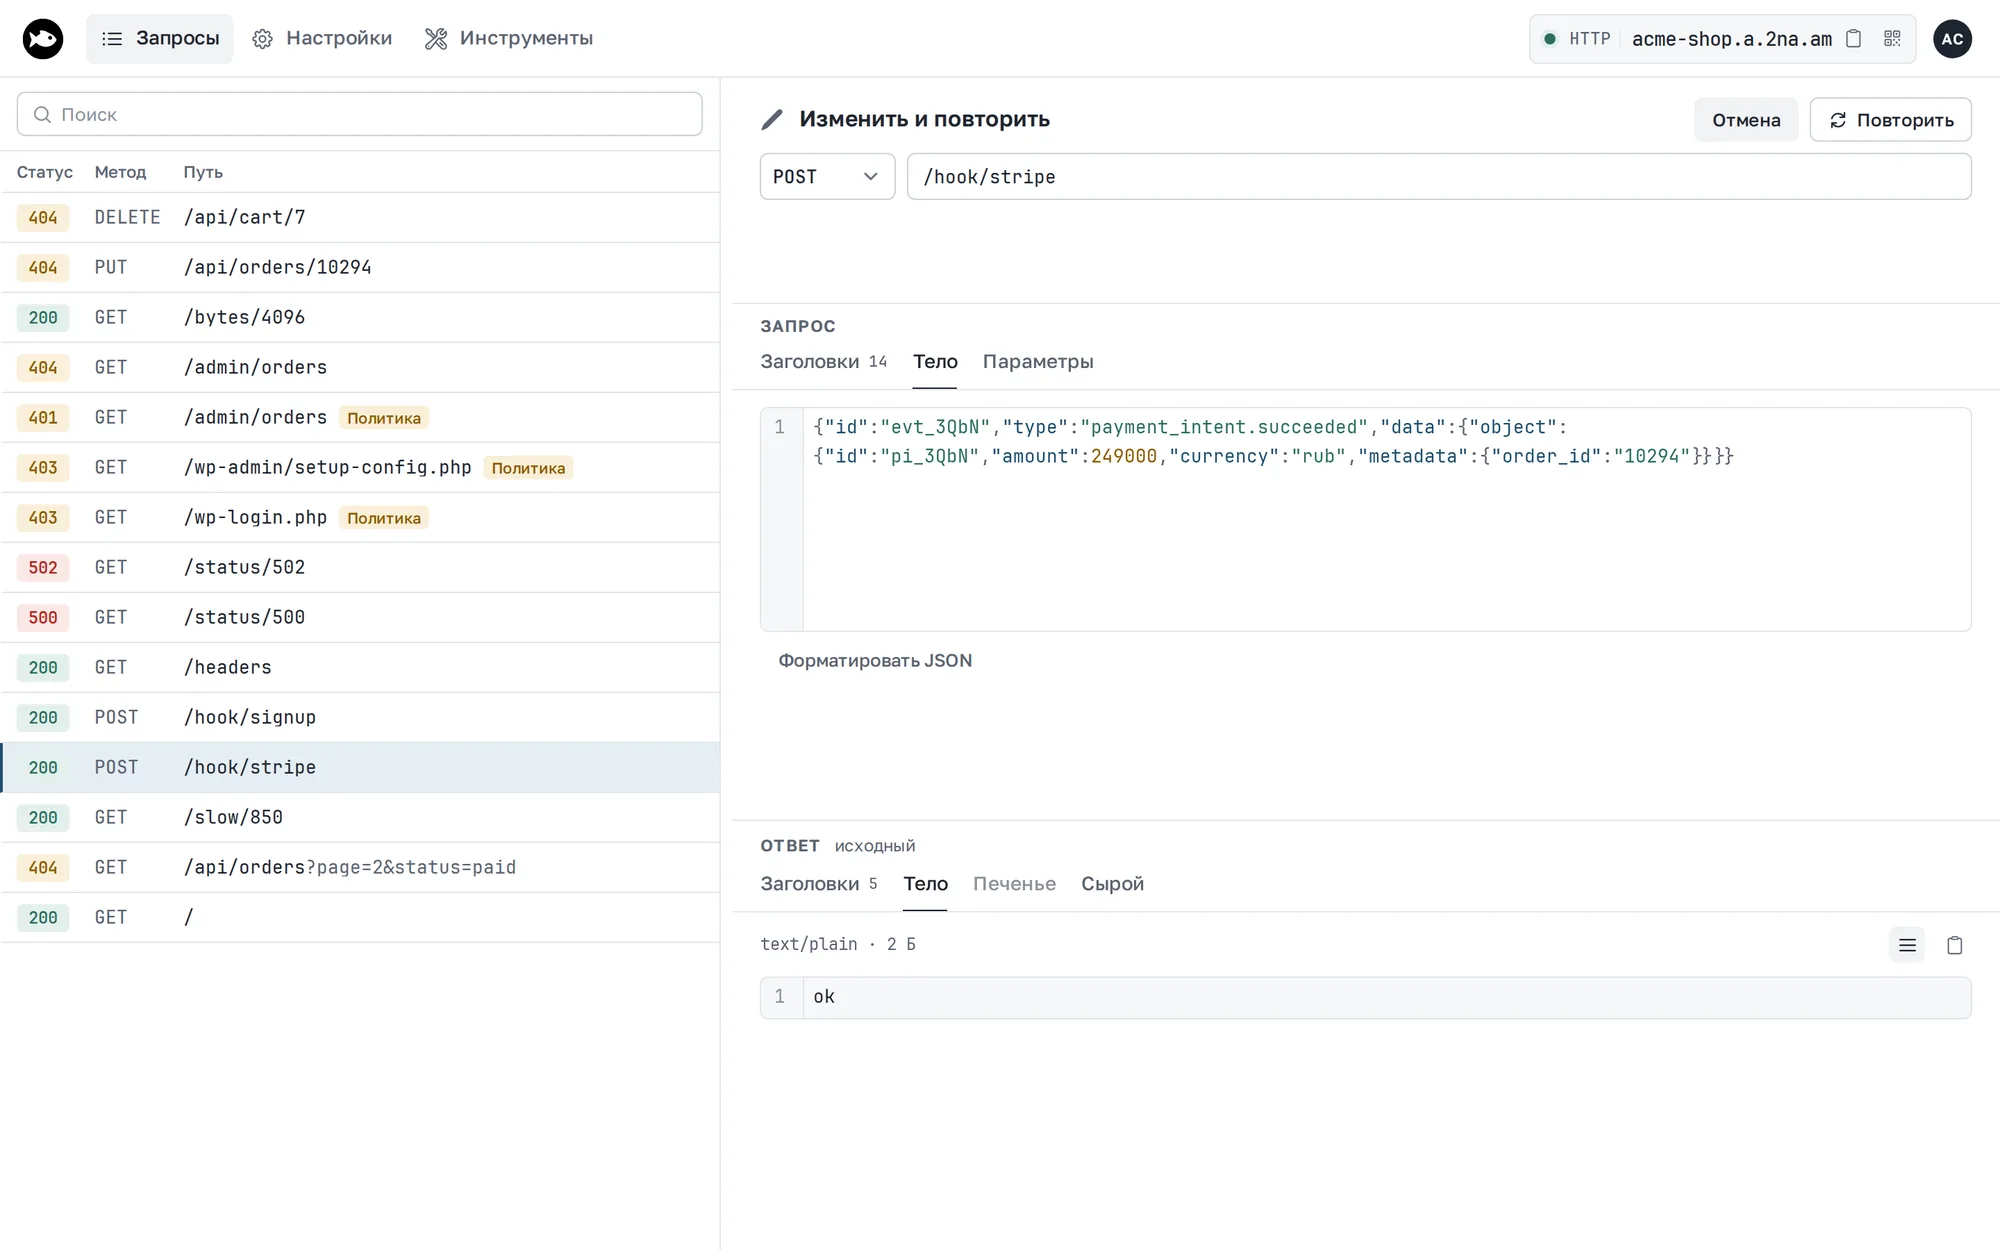
The request list and details take the full height of the window, and you can drag the border between them. On a wide monitor the request and response sit in two columns; on a laptop you switch between Request and Response.
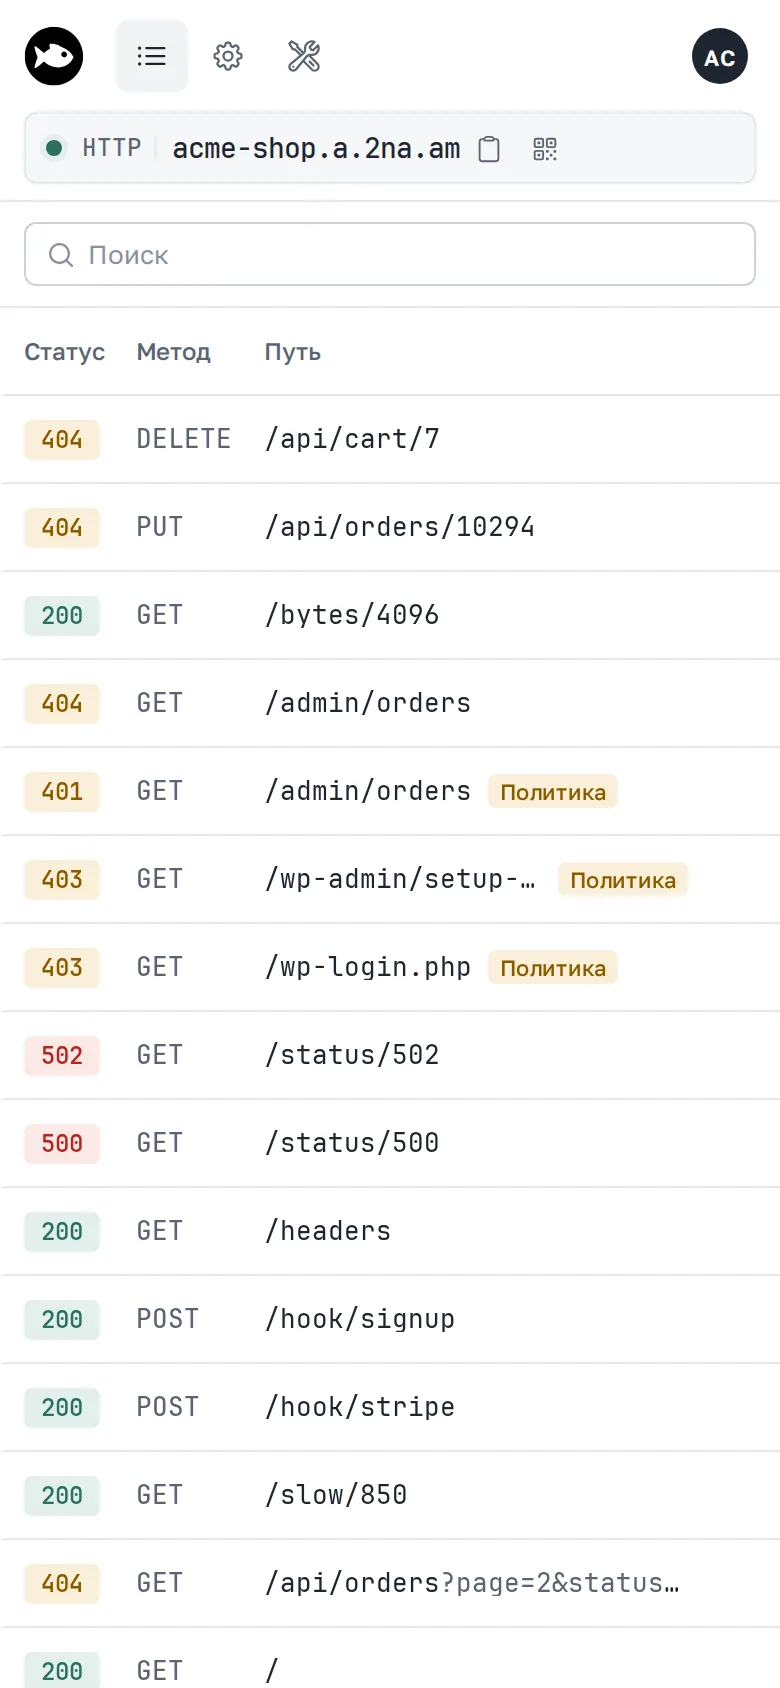
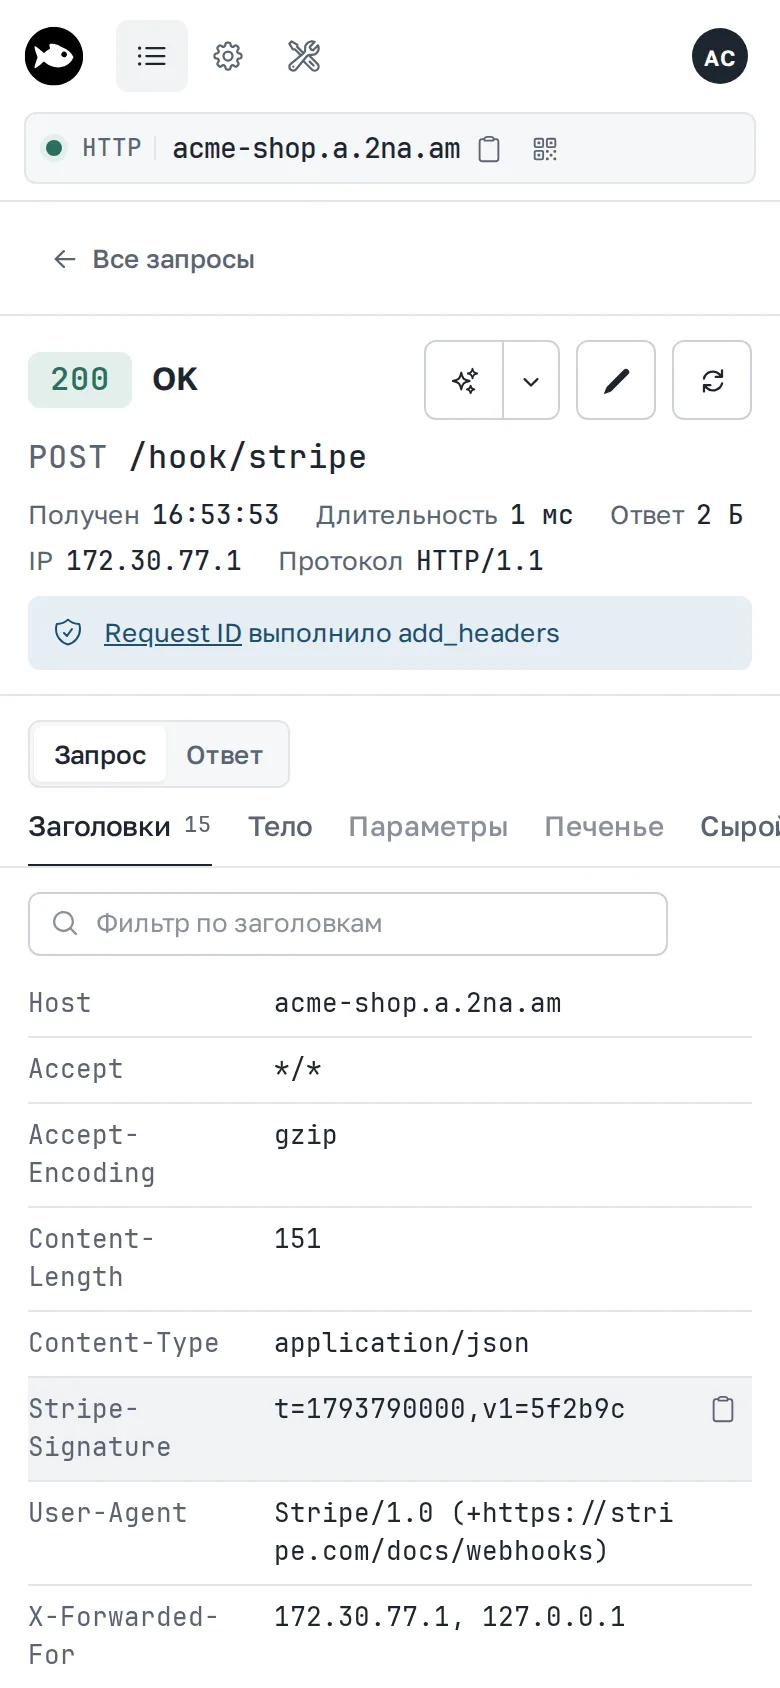
On a phone, the list and the details open as separate screens.
Request details
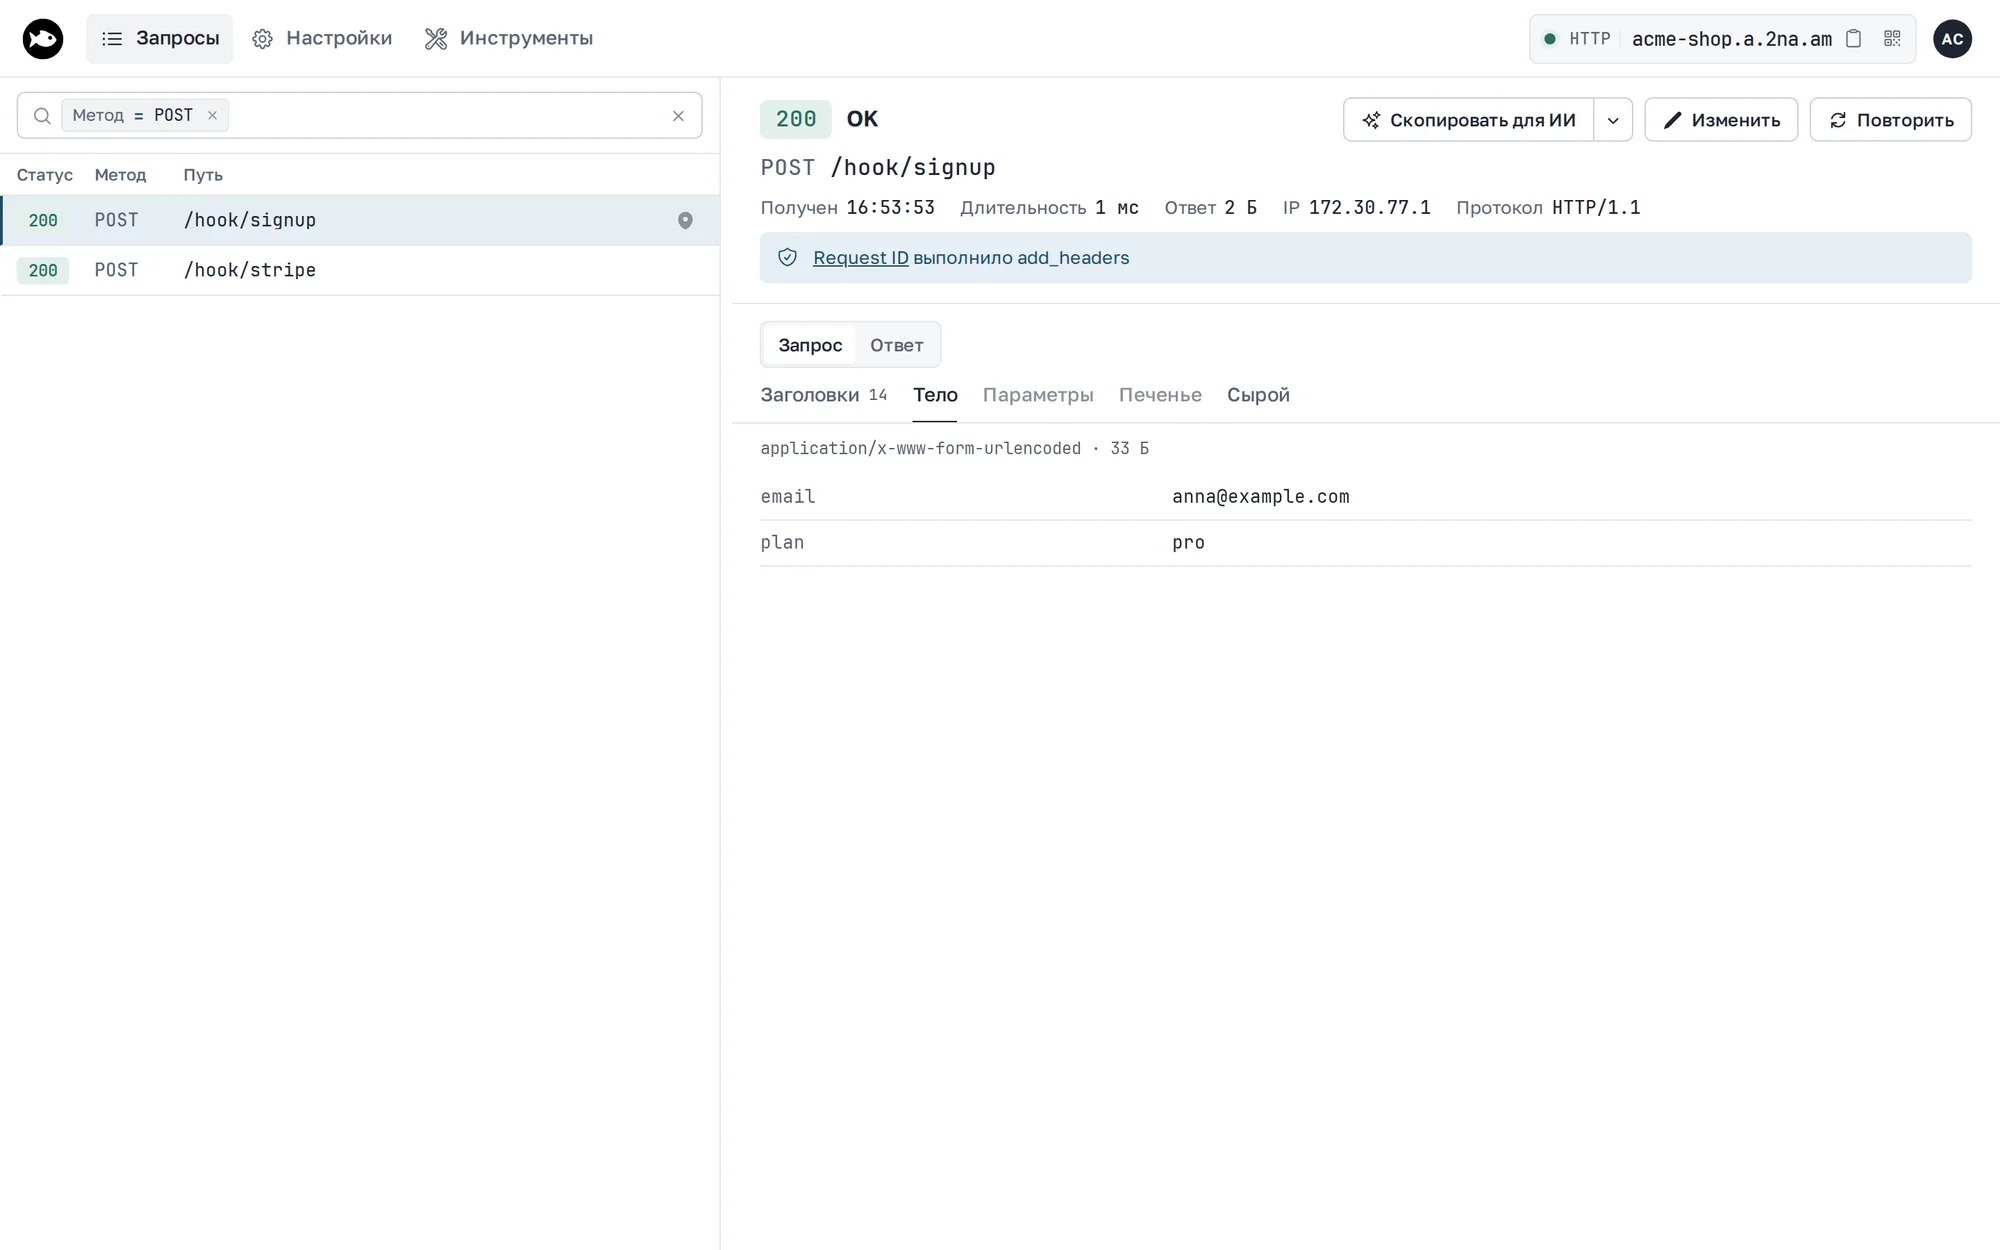
Headers, query parameters, and cookies have their own tabs: Headers, Parameters, and Cookies. A JSON body is highlighted and collapsible, forms are shown as a table, and the Raw mode shows the request as is.
A header value opens straight in a tool: Decode JWT, Read as time, and Decode Base64. The value goes to the tool directly, so the token never ends up in the page URL.
Filters
Type a path or a filter token into the search box: method:POST, status:500, a header, an IP, who answered, a matched rule. Clicking the status, method, or path in the details adds a filter; with Alt, it adds an exclusion. Click a token's operator to change it.
Rejected requests
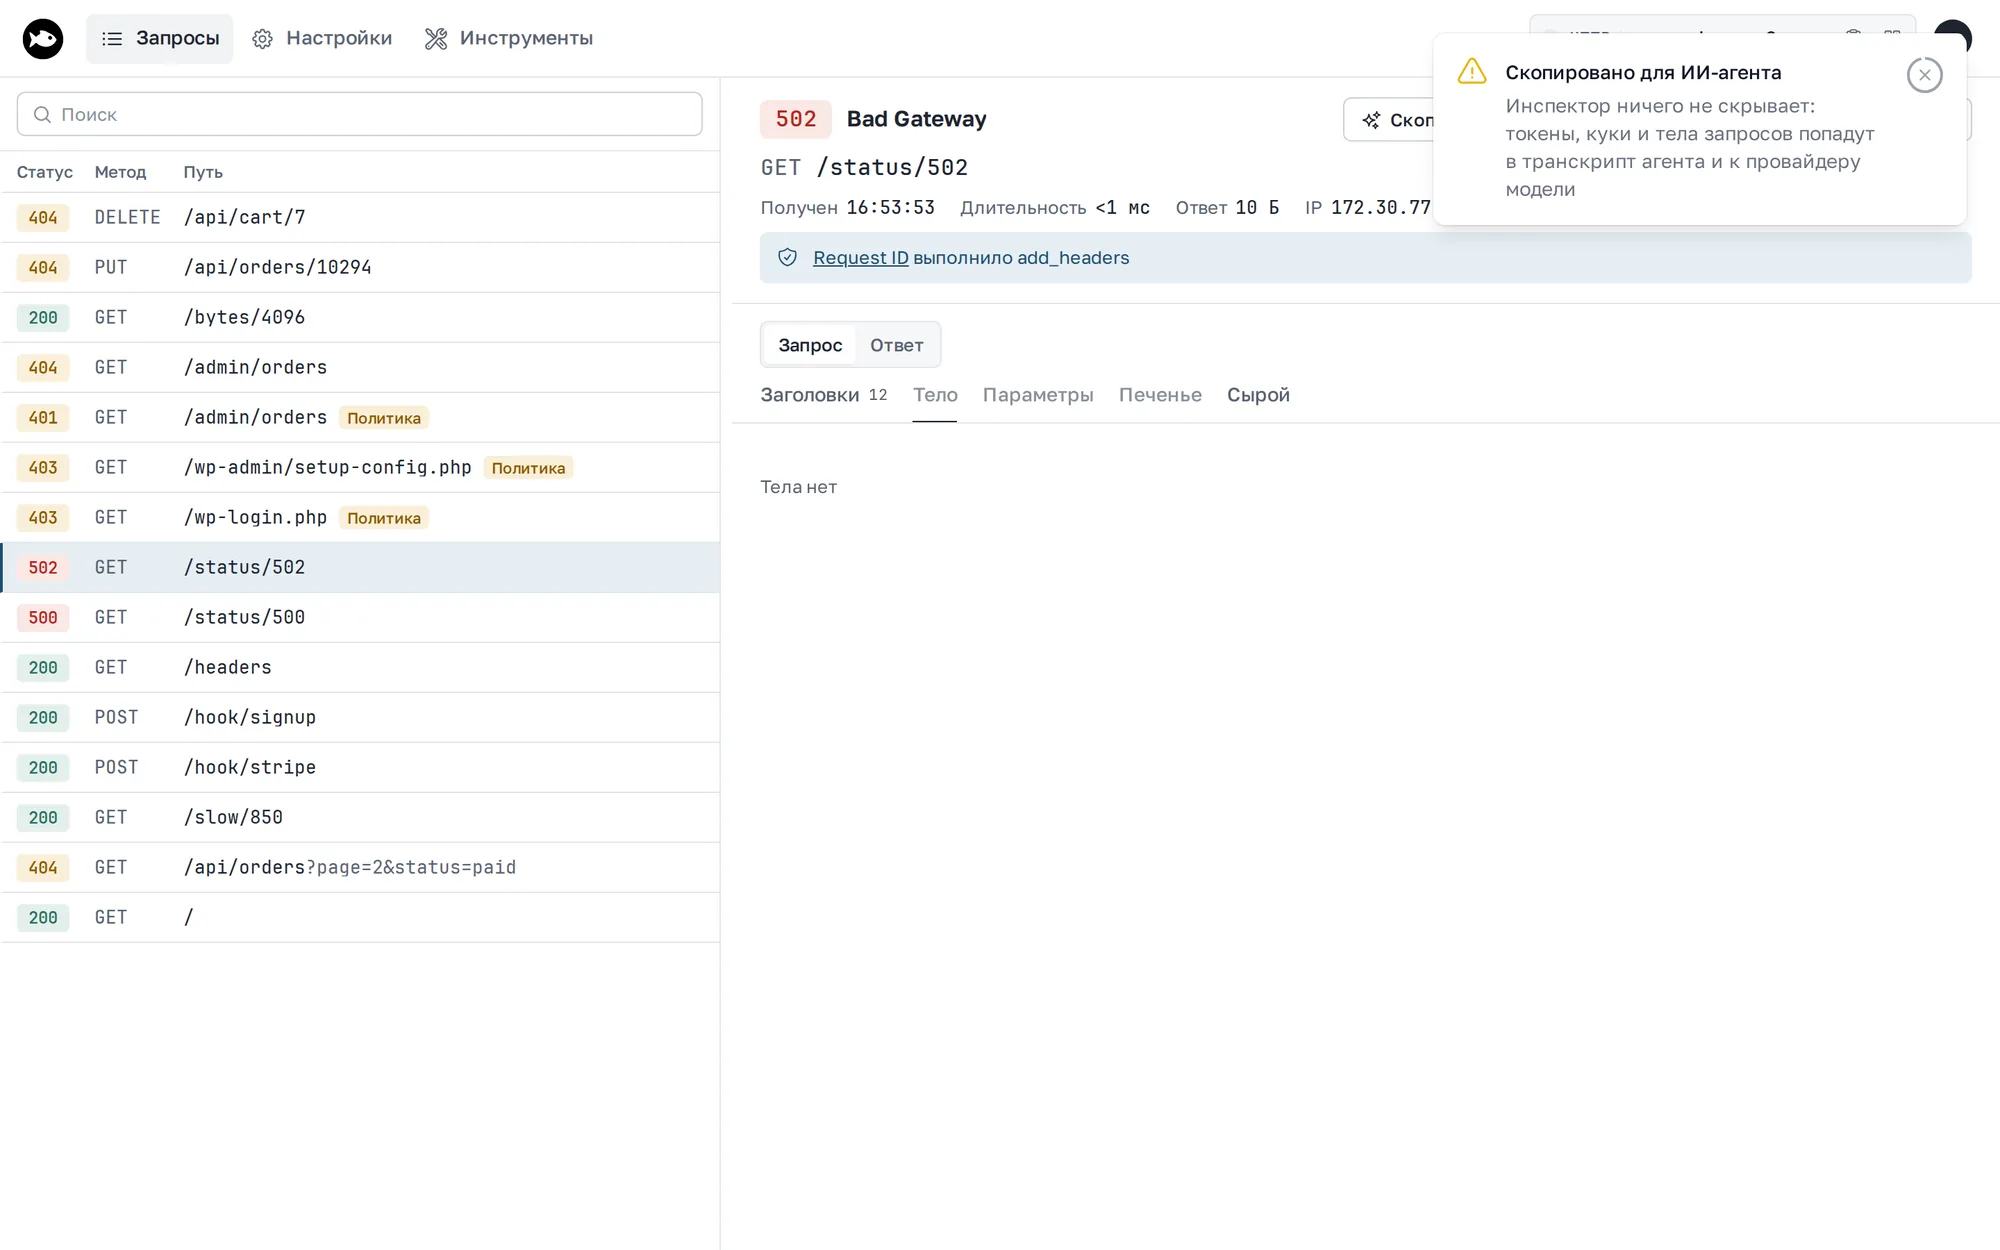
A request rejected by --basic-auth, --key-auth, --cidr-allow, --cidr-deny, a traffic policy, or webhook signature verification also shows up in the inspector. In the list it carries a Policy label; the details show who answered instead of the application and which rules matched.
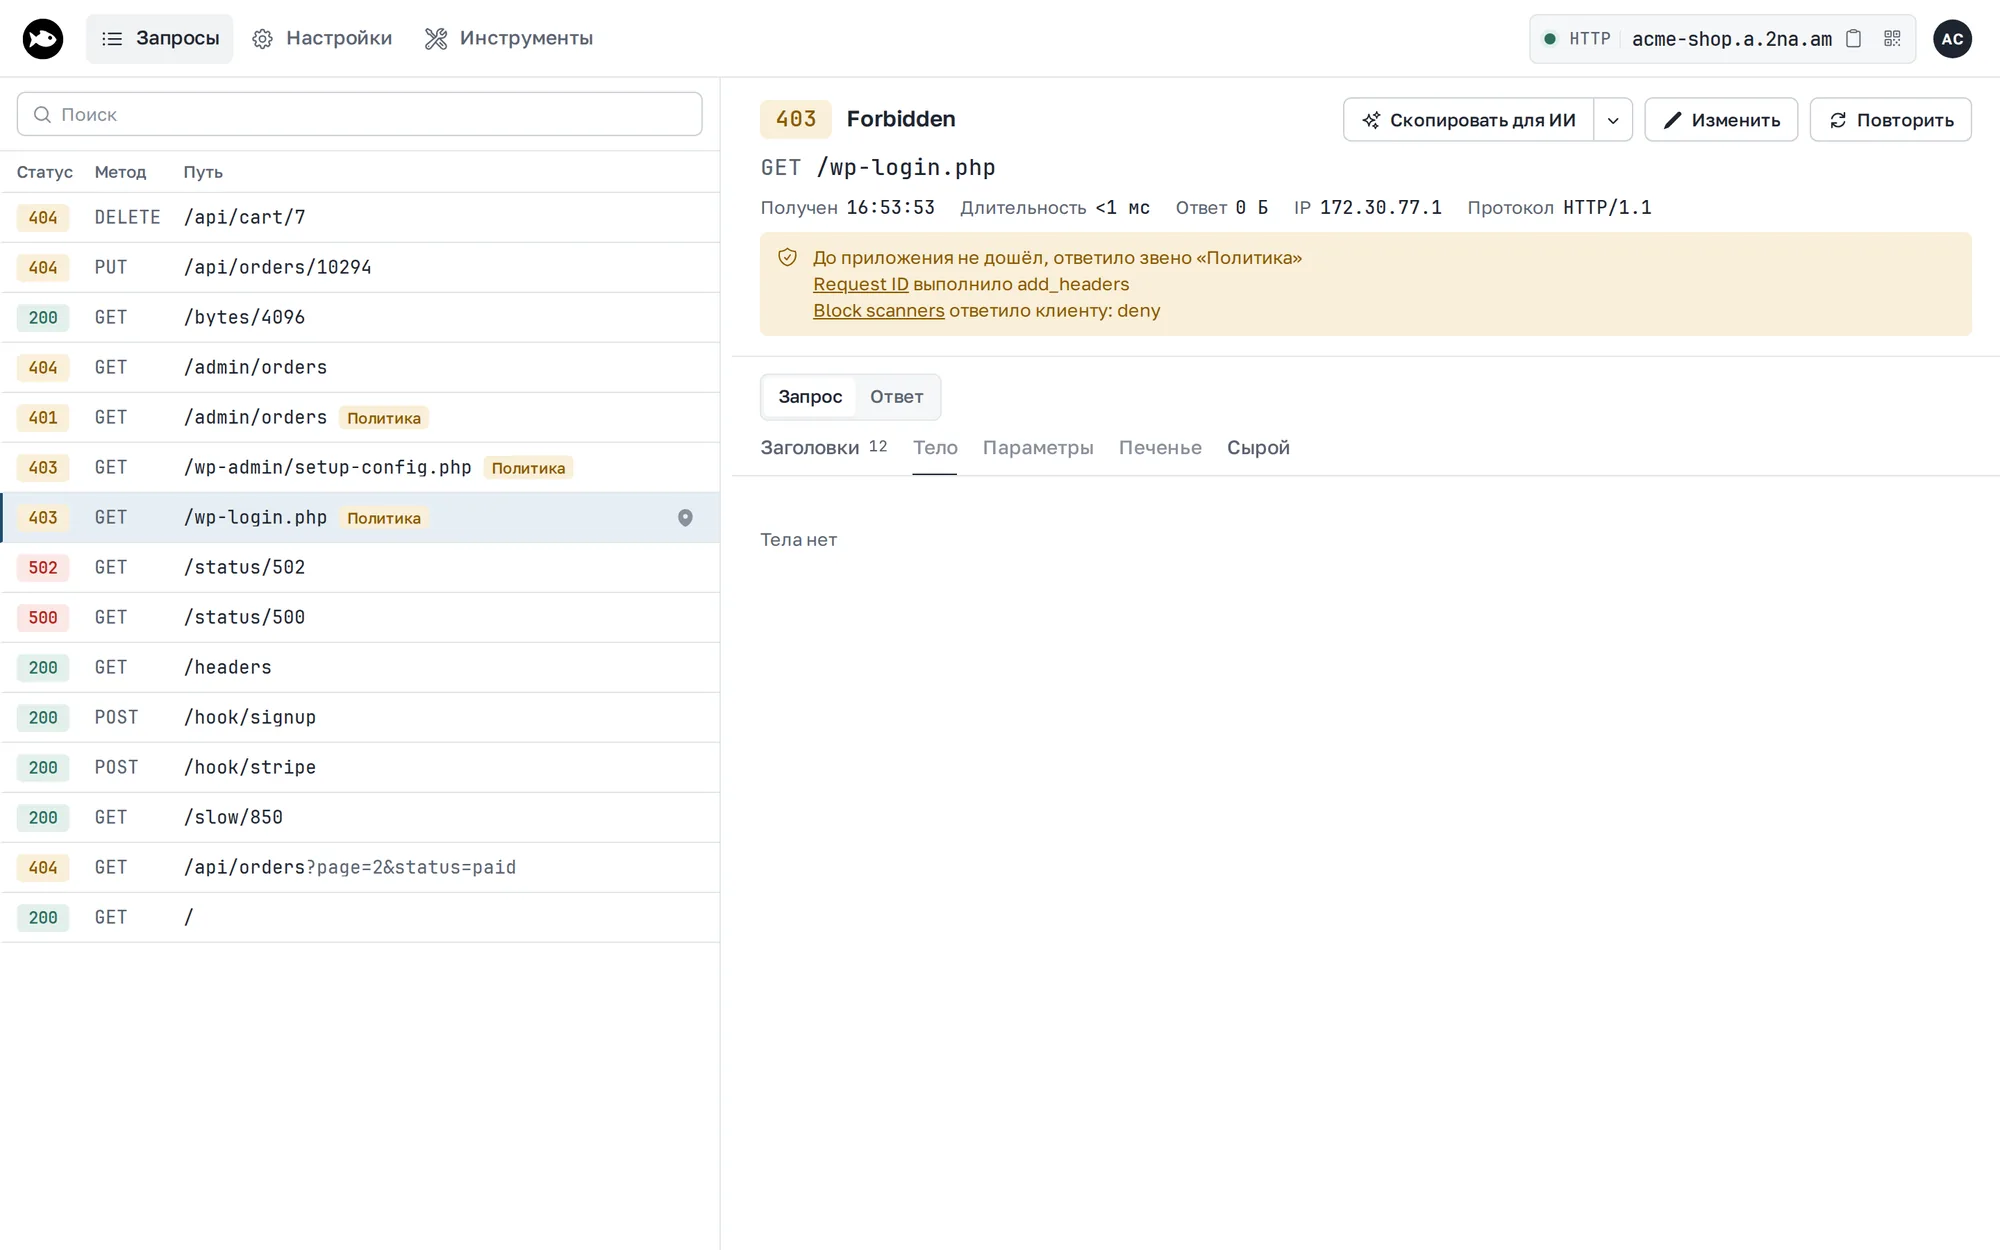
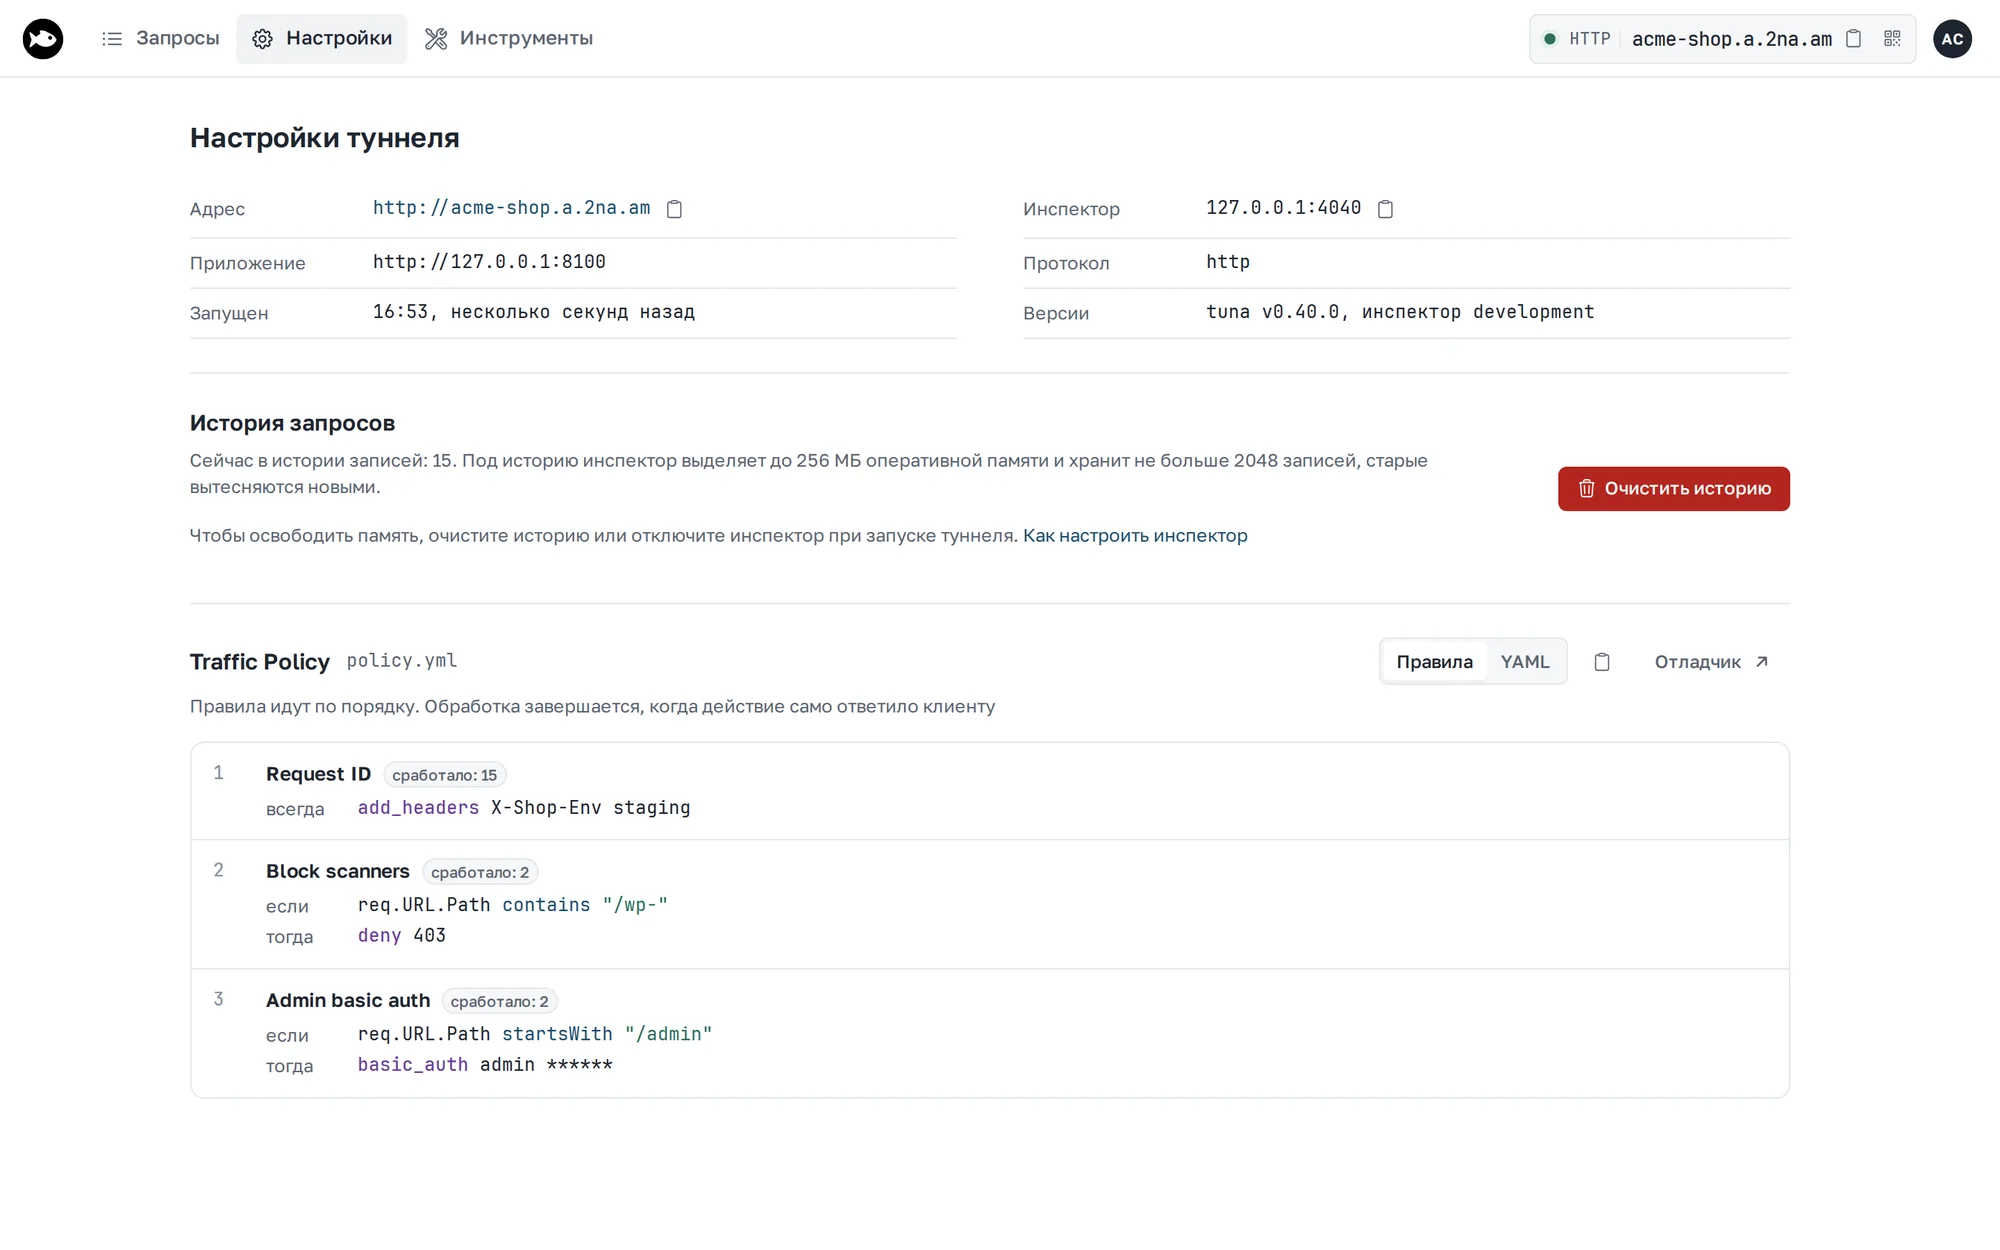
Every request shows the policy rules that matched it. Settings lists the rules with their numbers and match counters, a YAML tab, and a link to the policy debugger.
Replaying a request
Replay sends the request through the public tunnel address once more. The body goes out byte for byte, so the webhook signature still matches on replay.
Edit opens an editor in place of the request: method, path, headers as a table, and body, with the original response next to them.
Databases
For tuna postgres, tuna mysql, and tuna redis, the inspector shows sessions: user and database, first query, start time, number of events and errors, and whether the session is open or closed. You can search by user, database, and query text, and collapse the list.
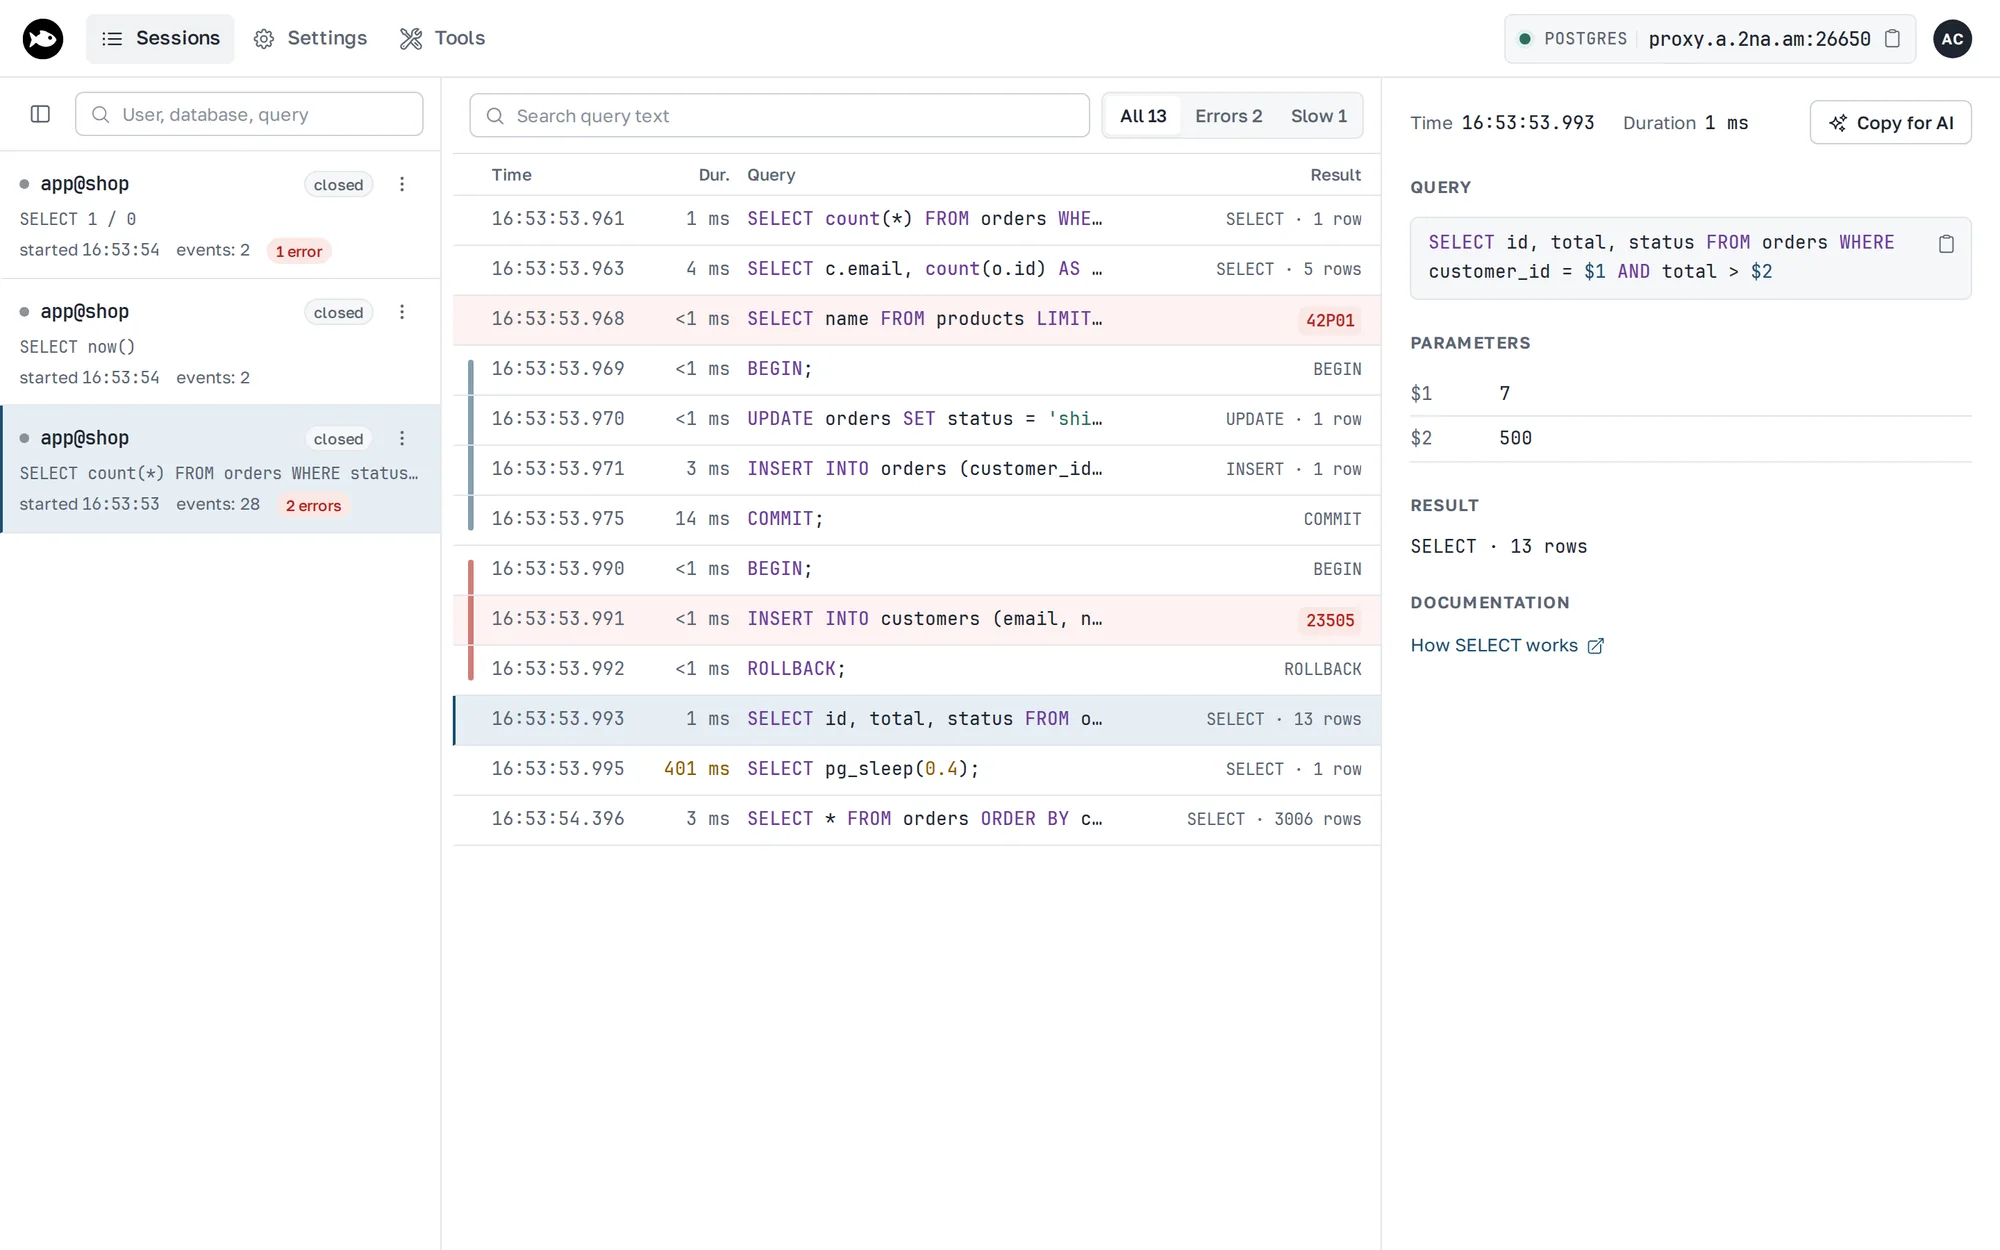
In the session log, each query has a duration and a result, and errors come with a code. Transactions are marked with a bar, and rollbacks with a red one. The Errors and Slow tabs filter the log. A command links to its documentation, and an error links to the description of its code.
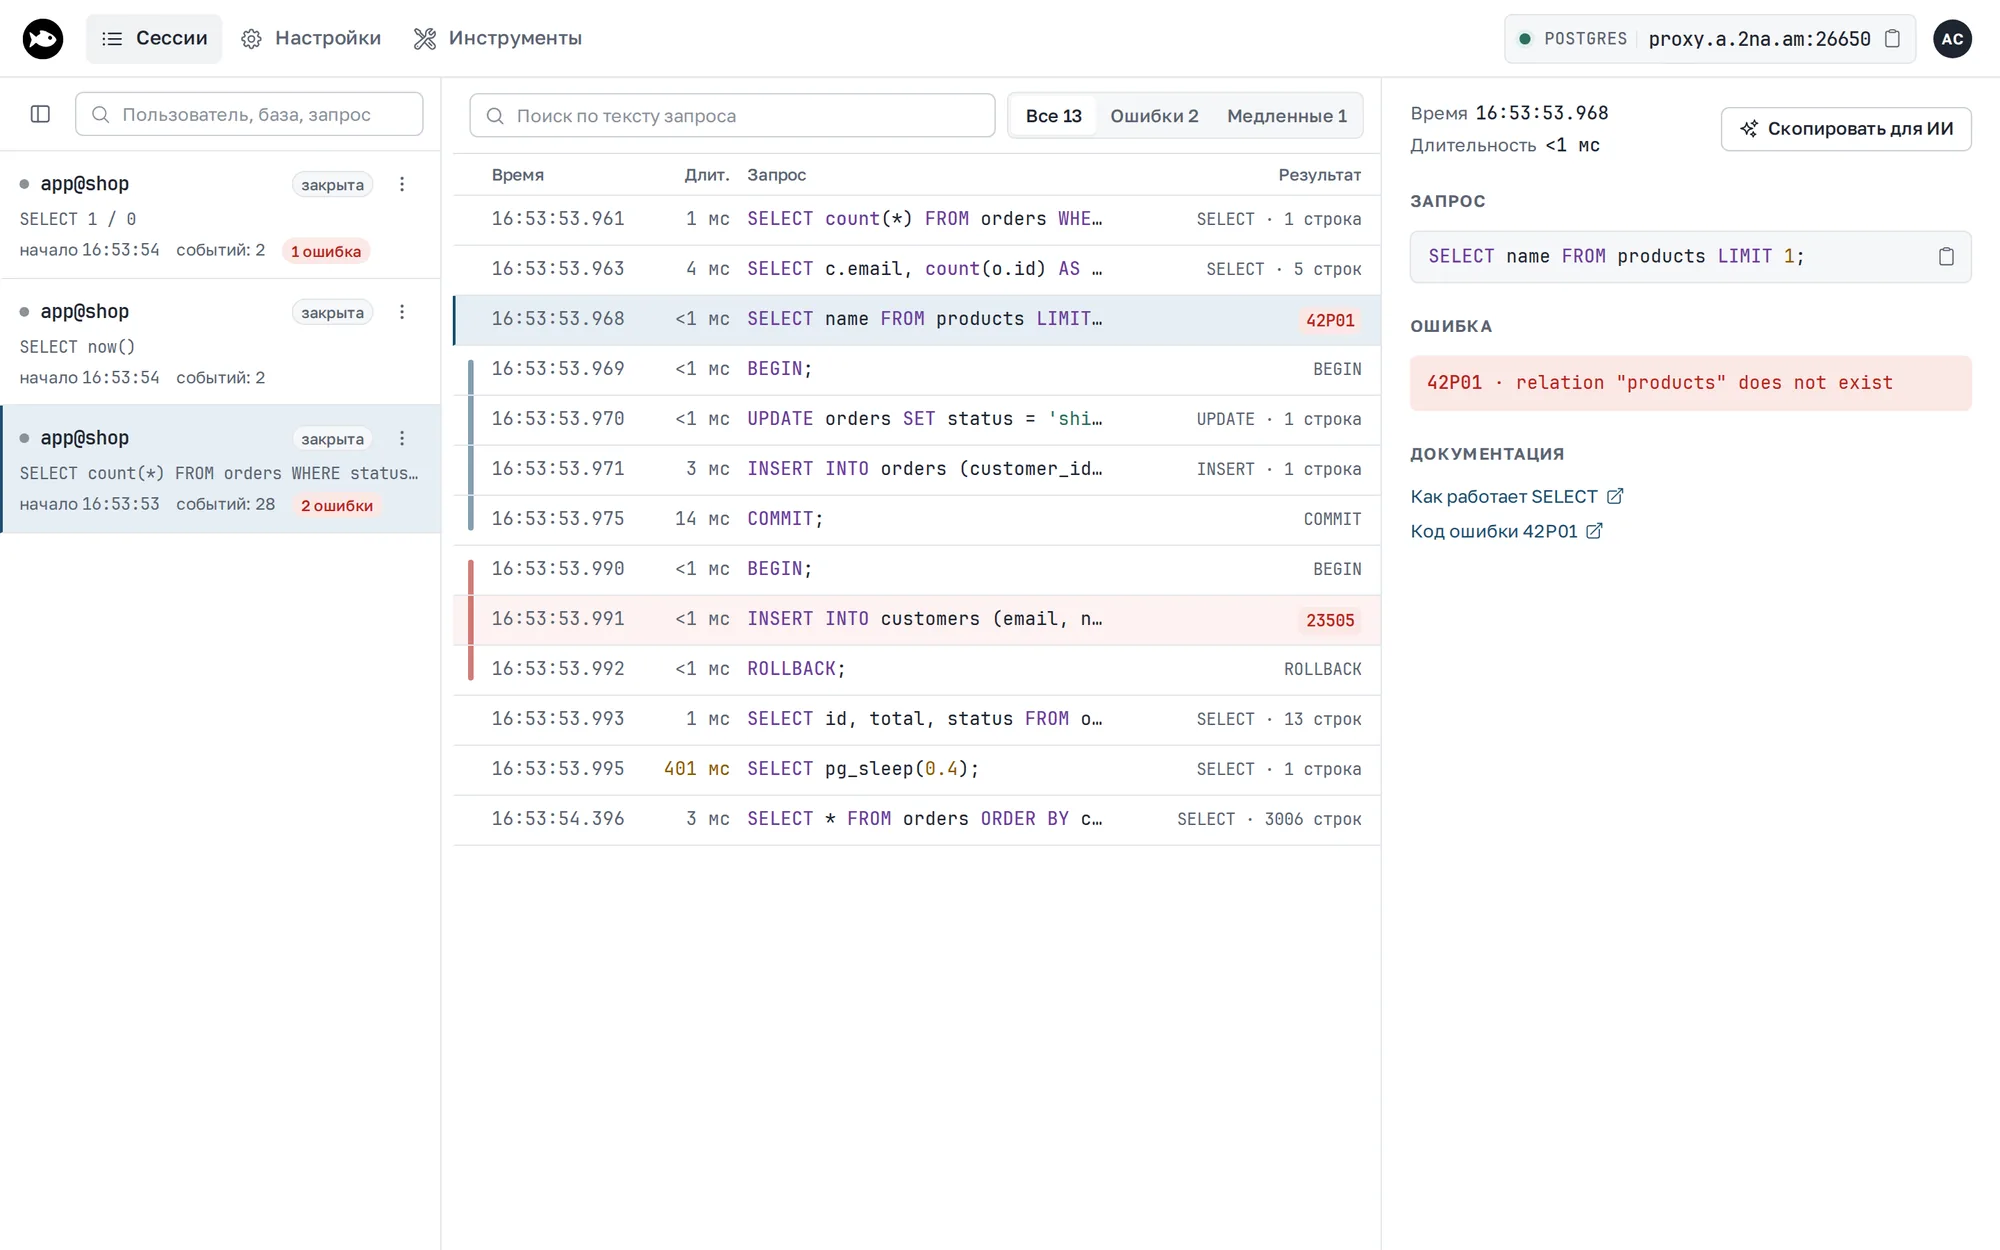
Clearing the history removes only closed sessions.
PostgreSQL
The result is shown as a command tag with a row count (UPDATE 1). For prepared statements, you see the query text and the $1, $2 parameters.
MySQL
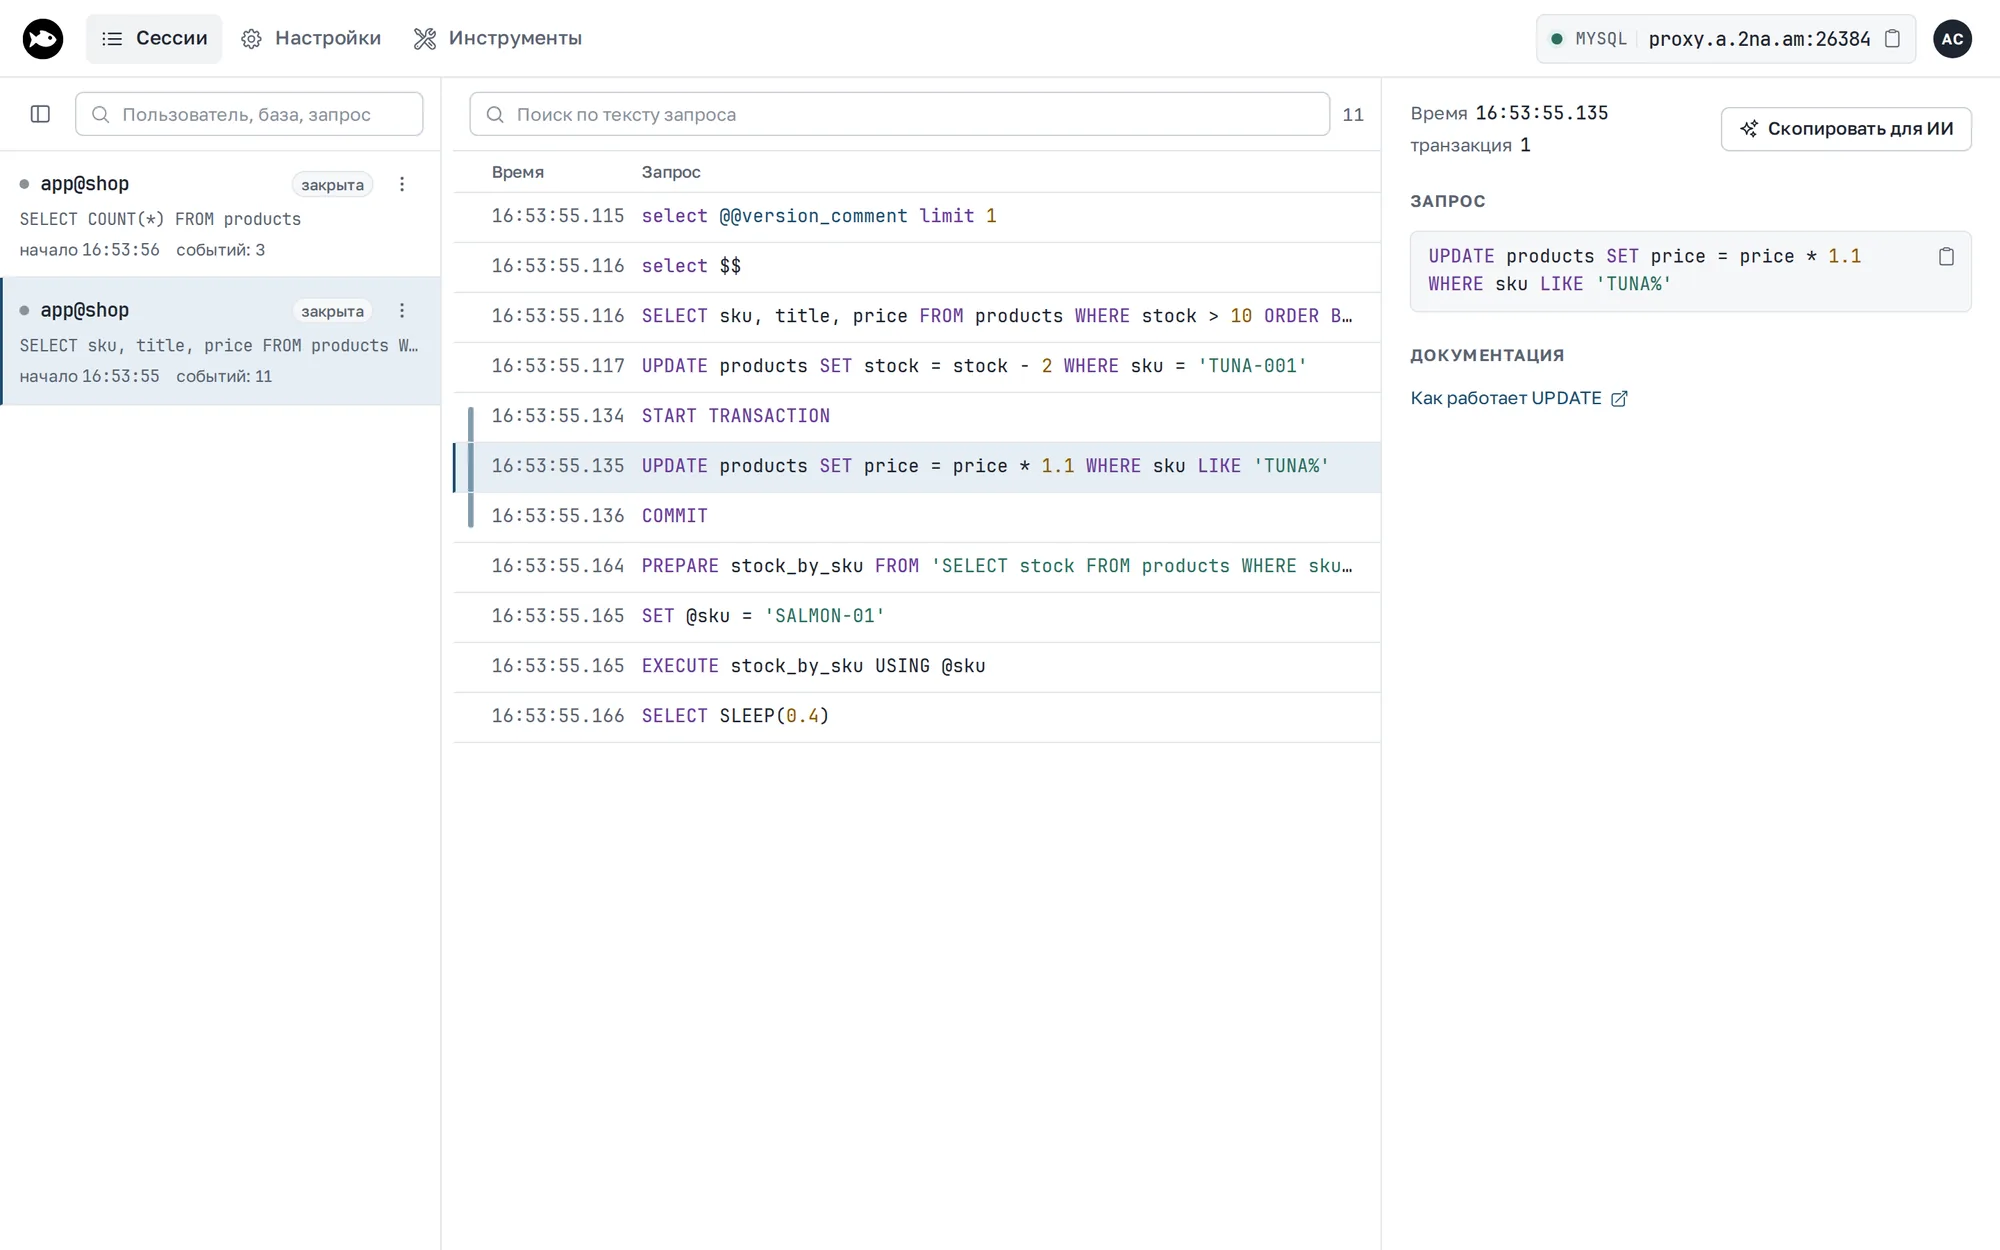
You see queries, transactions, and PREPARE/EXECUTE. The inspector doesn't parse server responses, so MySQL sessions have no row counts or errors.
Redis
The database number is part of the session name: after SELECT 1 it becomes default@db1. Arguments with spaces and binary values are quoted the way redis-cli does it. MULTI/EXEC are marked with a bar, like transactions.
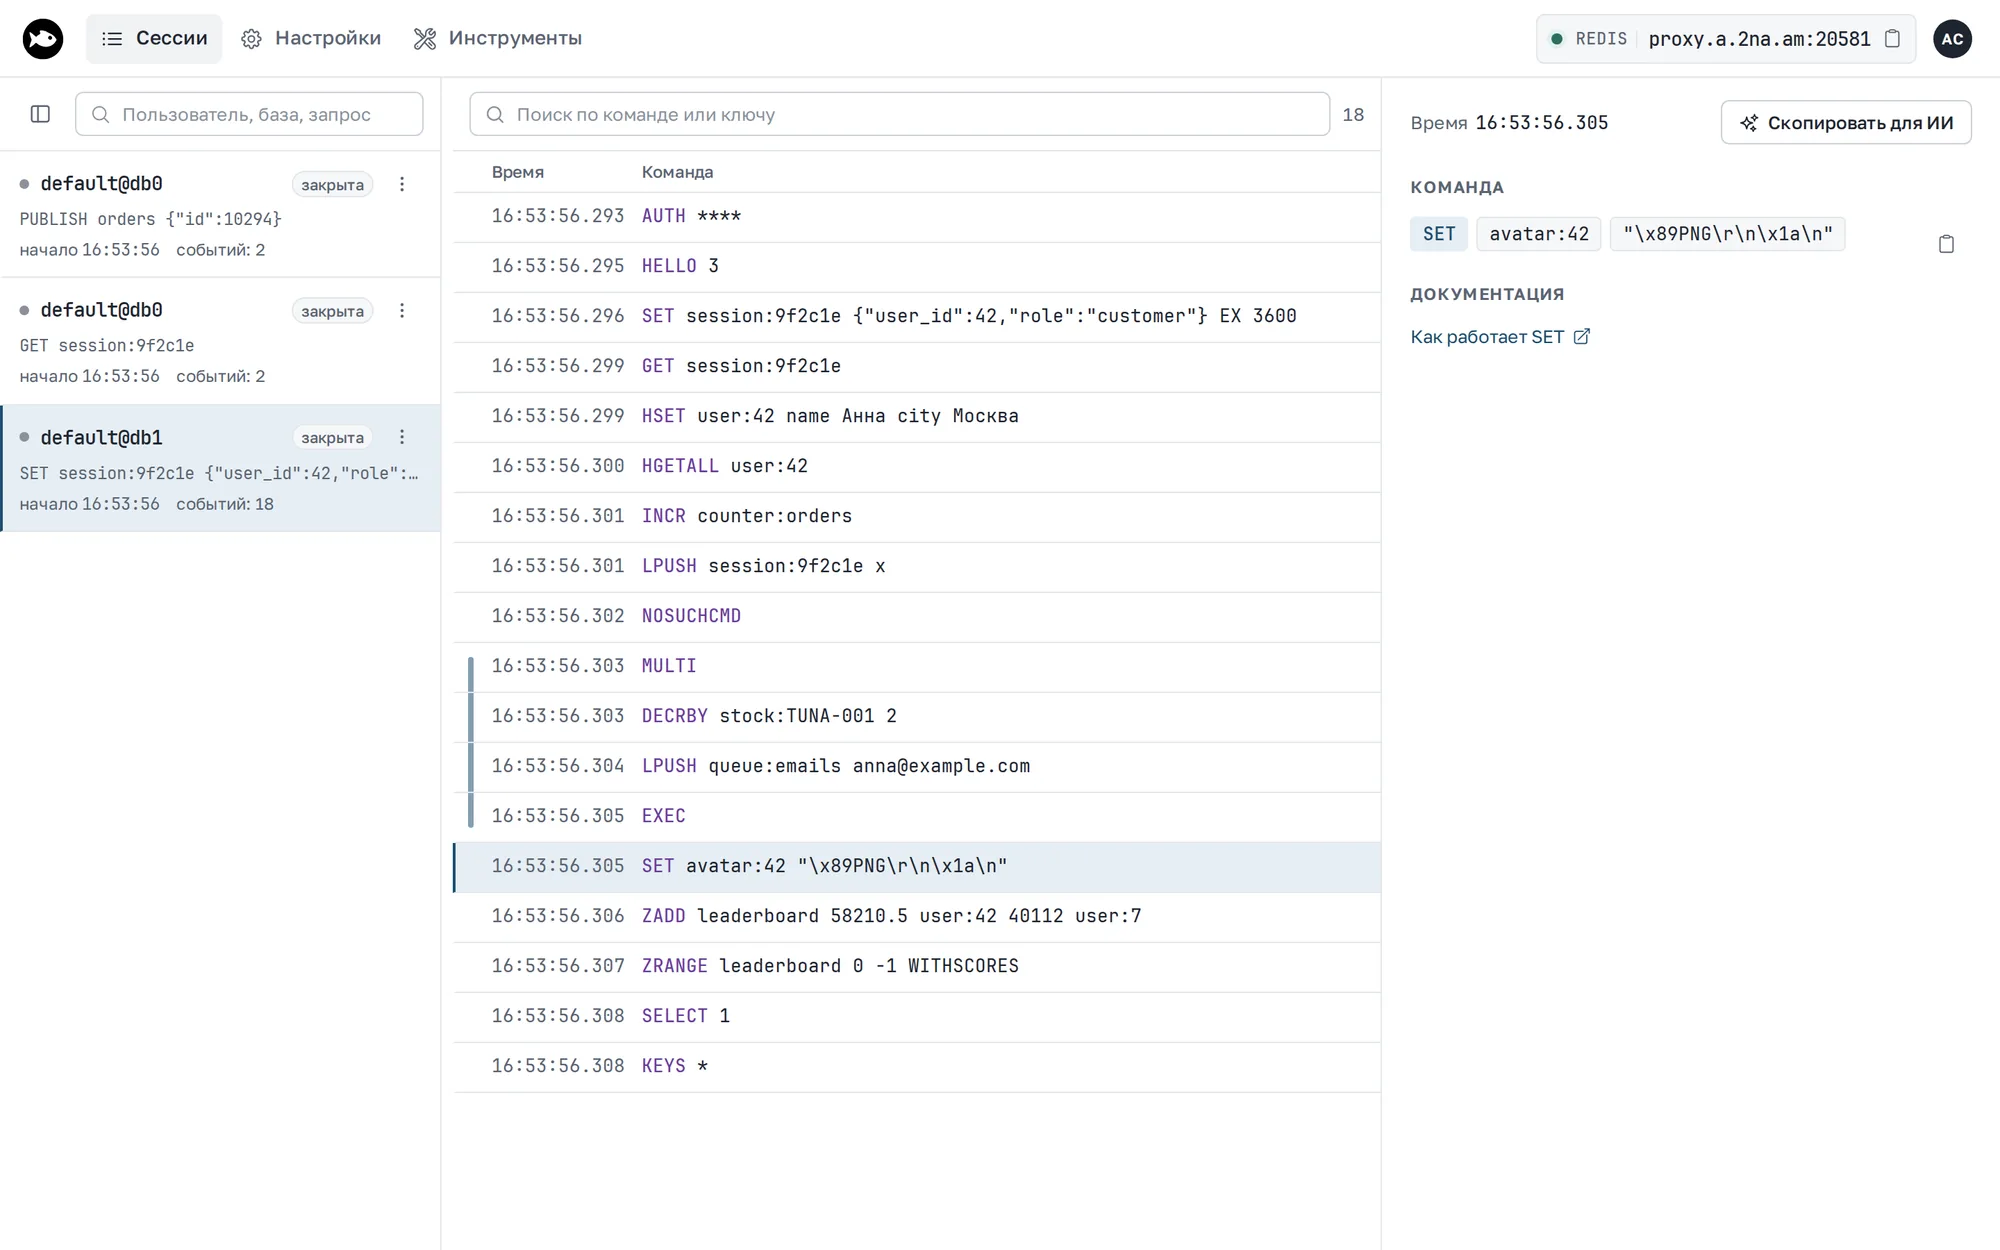
RESP3 (HELLO 3, redis-cli -3), inline commands (PING from nc or telnet), and redis-cli --pipe work through the tunnel.
AI agents
Claude Code, Cursor, and other agents read the inspector through its HTTP API. Instructions for the agent live at http://127.0.0.1:4040/llms.txt, with live addresses and ready-made curl commands. You don't need a separate CLI command: just give the agent a link to llms.txt.
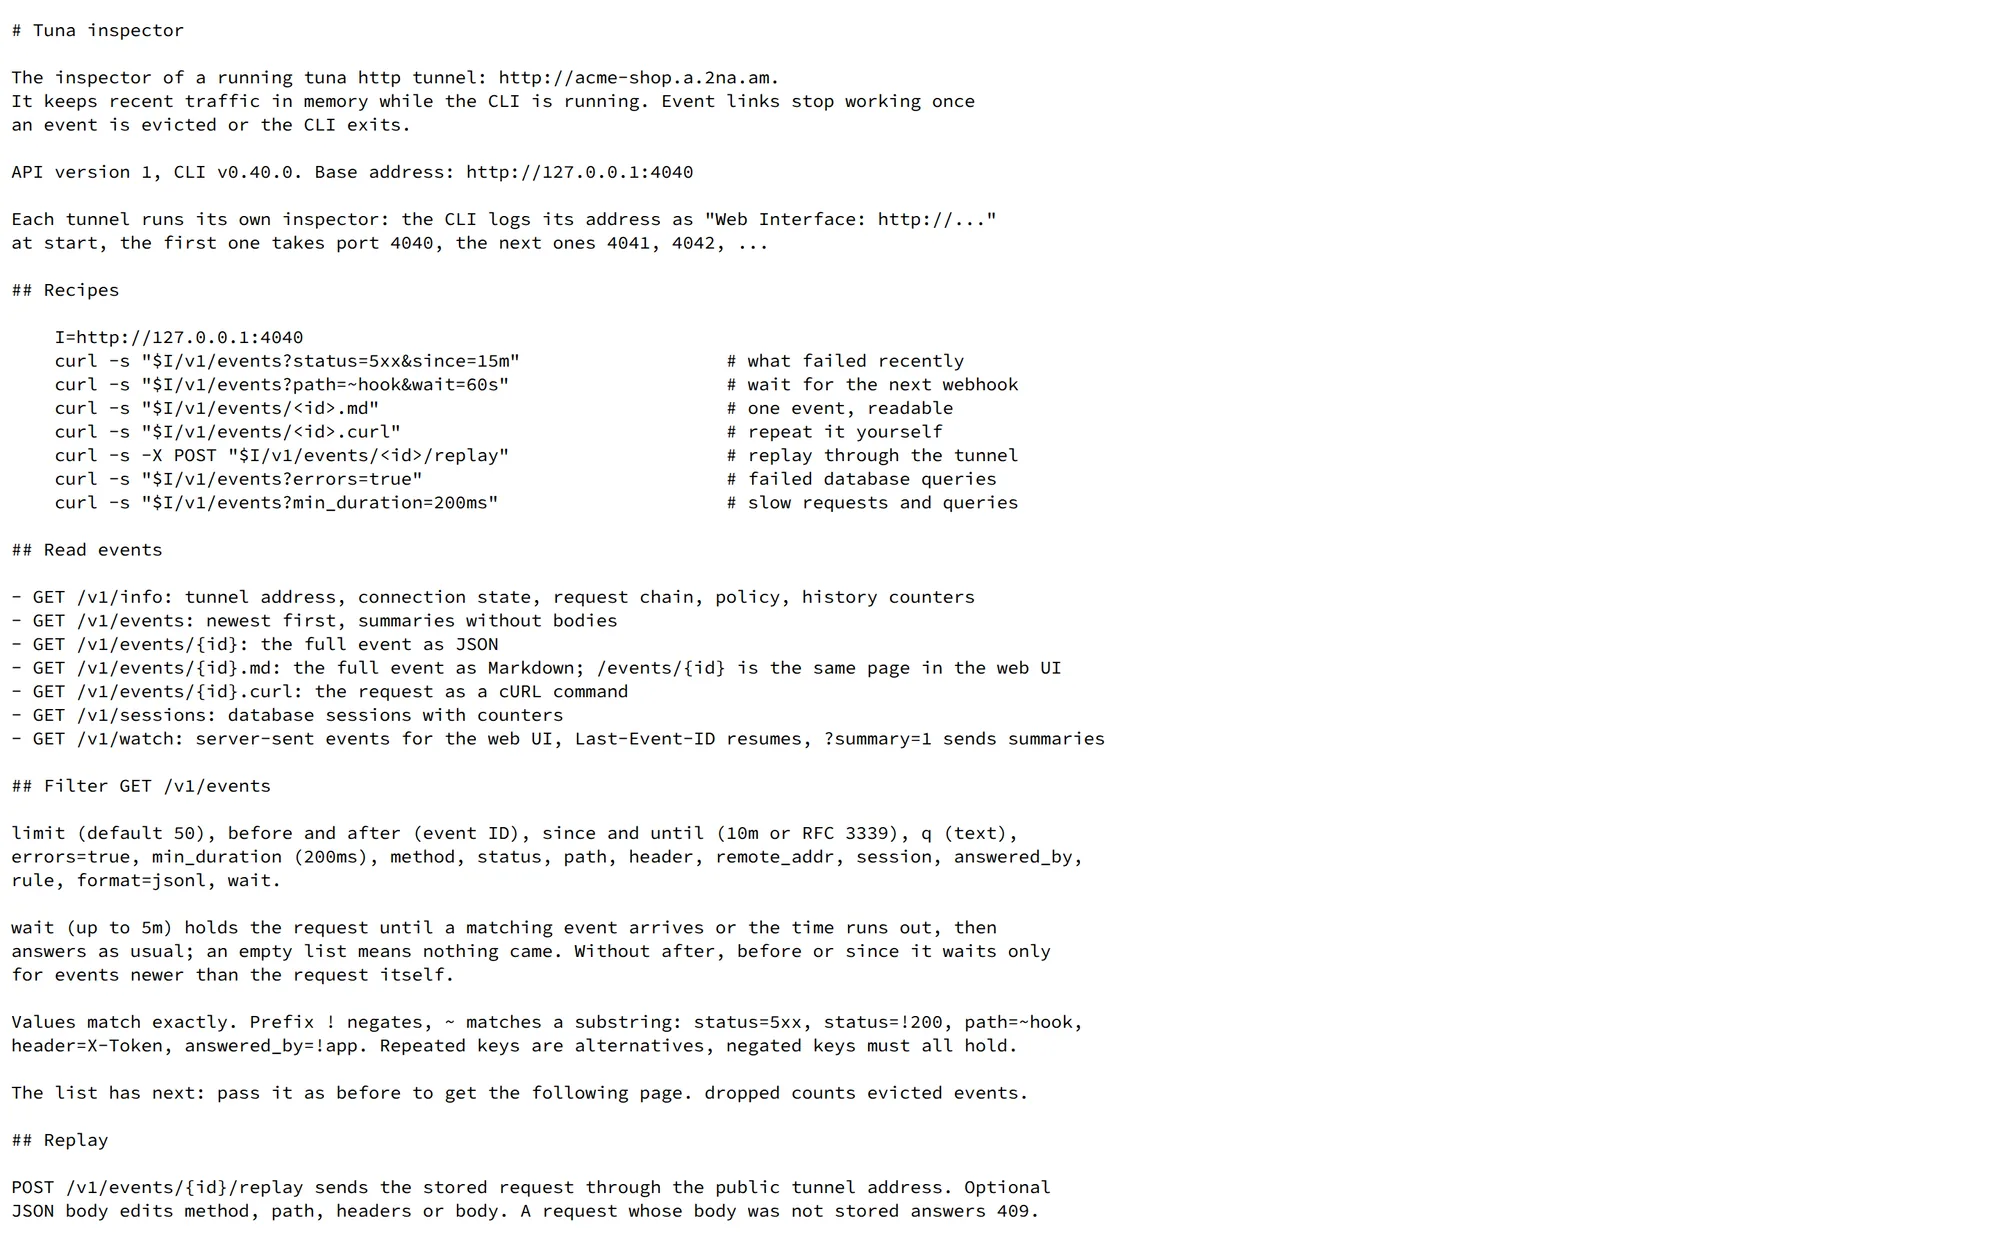
The main requests:
I=http://127.0.0.1:4040
curl -s "$I/v1/events?status=5xx&since=15m"     # what failed in the last 15 minutes
curl -s "$I/v1/events?path=~hook&wait=60s"      # wait for the next webhook
curl -s "$I/v1/events/<id>.md"                  # one event as Markdown
curl -s "$I/v1/events/<id>.curl"                # a curl command to repeat it
curl -s -X POST "$I/v1/events/<id>/replay"      # replay through the tunnel
curl -s "$I/v1/events?errors=true"              # failed database queries
curl -s "$I/v1/events?min_duration=200ms"       # slow requests
| Method | Returns |
|---|---|
GET /v1/info | tunnel address, state, policy, and history counters |
GET /v1/events | list of events, newest first |
GET /v1/events/{id} | the full event as JSON, .md as Markdown, .curl as a curl command |
POST /v1/events/{id}/replay | replays the request; the body can change the method, path, headers, and body |
GET /v1/sessions | database sessions |
GET /v1/events filters: status, method, path, header, remote_addr, answered_by, rule, session, q (text), errors=true, min_duration, since and until, the before and after cursor, limit, format=jsonl. The ! prefix excludes a value and ~ matches a substring: status=!200, path=~hook.
wait=60s (up to 5 minutes) holds the request until a matching event arrives. This way the agent waits for a webhook without polling the inspector in a loop. Without after, before, or since, it waits only for new events.
The Copy for AI button in the request details copies a link to the event and to llms.txt. A person who opens /events/{id} sees the inspector screen, while an agent gets Markdown.
The inspector masks nothing. Tokens, cookies, bodies, and query parameters end up in the agent's context and with the model provider. The inspector warns about this when you copy, and llms.txt asks the agent not to repeat secrets in its answers. Be careful with production data.
Tools
The Tools section collects developer utilities. They all run locally and send your data nowhere.
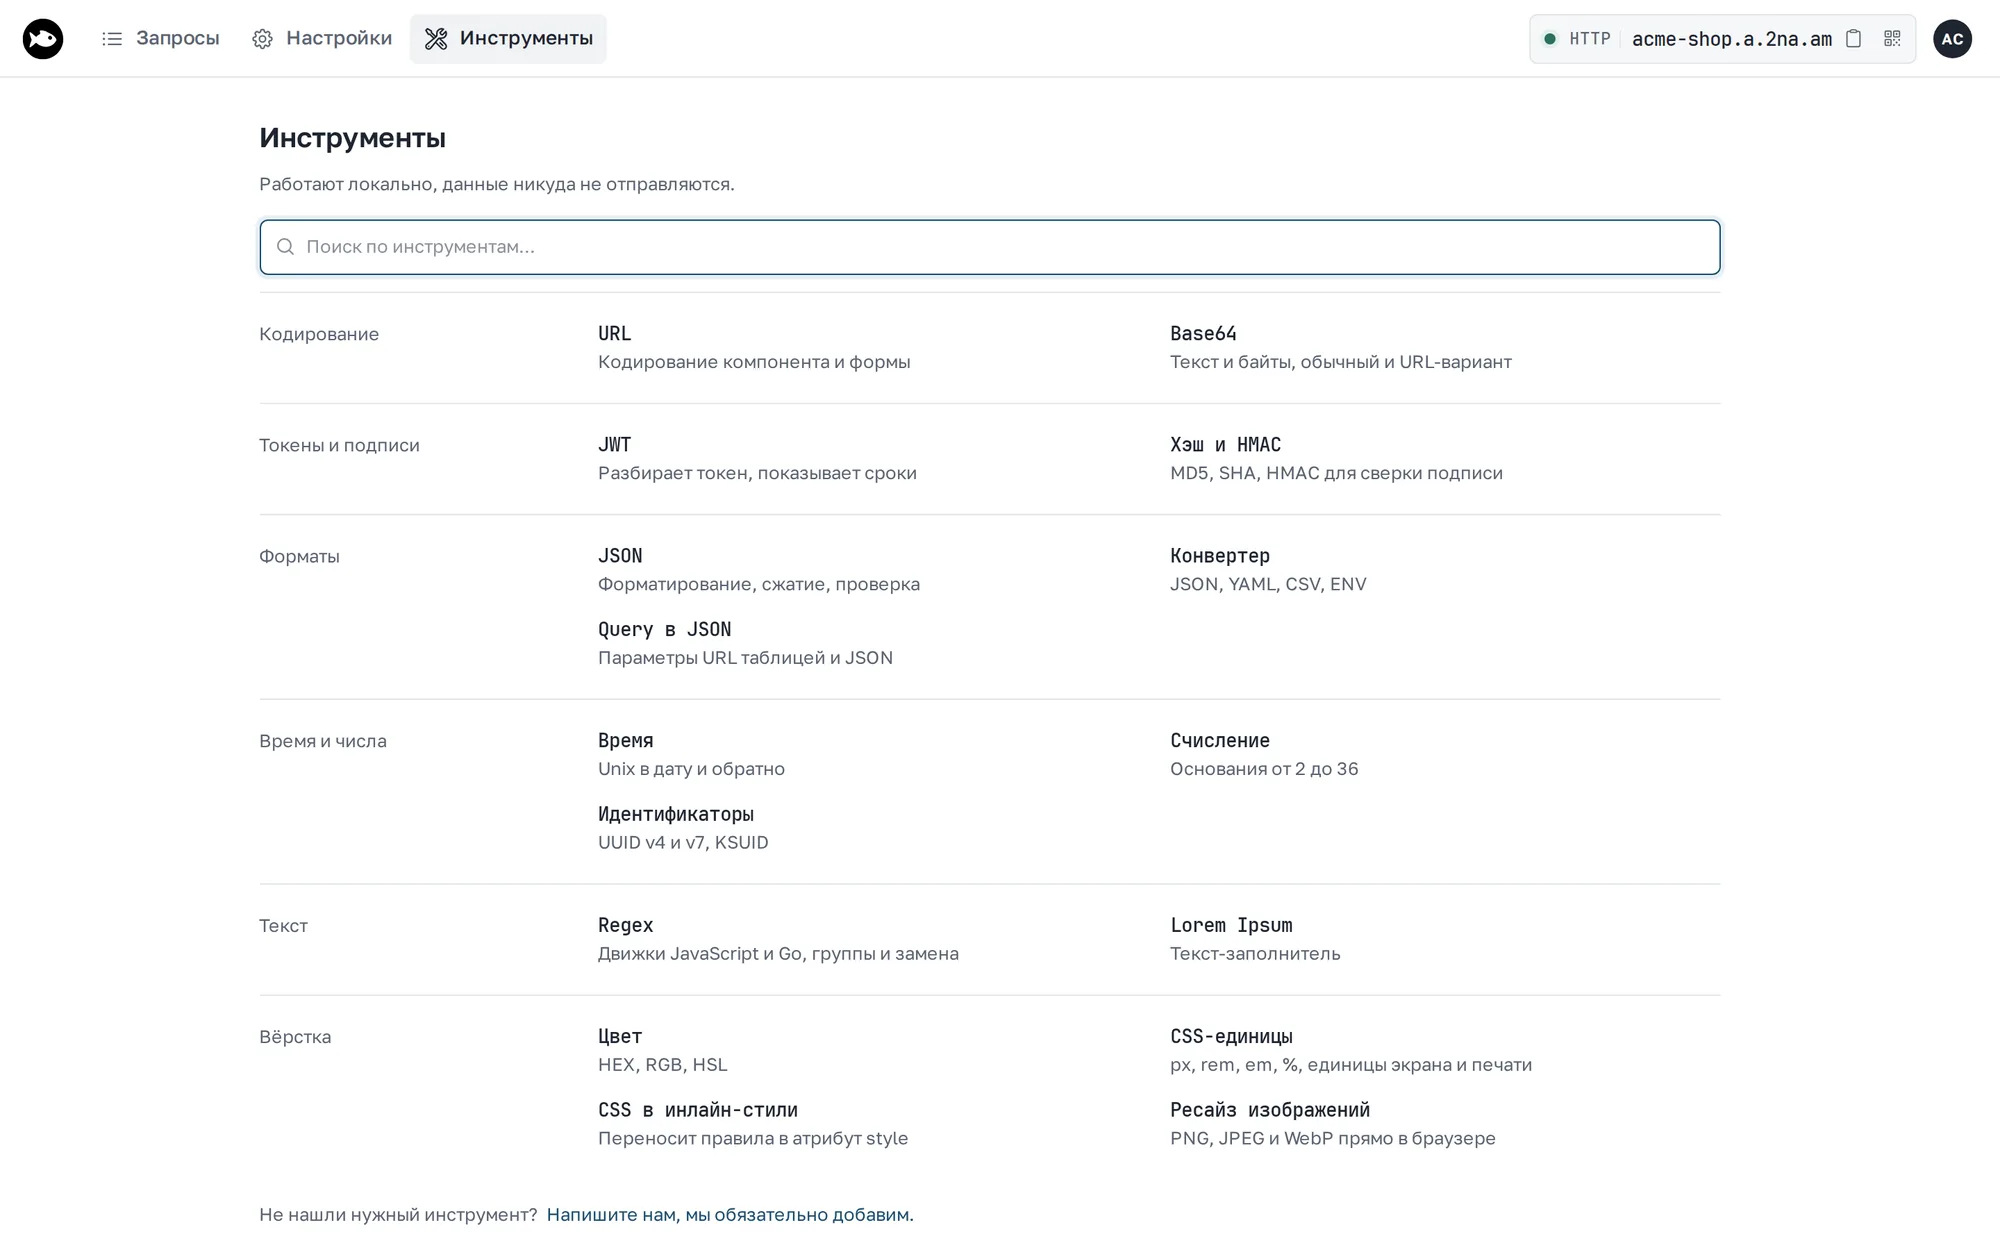
- URL Encode/Decode;
- Base64;
- JWT with key-based signature verification;
- hash and HMAC;
- JSON formatter;
- JSON, YAML, CSV, and ENV converter;
- query parameters to JSON;
- time and Unix timestamps;
- number bases;
- UUID v4, v7, and KSUID;
- Regex with JavaScript and Go engines — the Go engine is the same one
matchesuses in traffic policies; - Lorem Ipsum;
- colors;
- CSS units and CSS to inline styles;
- image resizing.
Missing a tool? Let us know.
Theme, language, and QR code
Switch to the dark theme and English in the profile menu. It also shows your account name and email, and links to the dashboard.
The QR code icon next to the tunnel address in the header shows a link to the tunnel, which is handy for opening it on a phone.