Request Inspector
Overview
The request inspector allows you to debug incoming requests, view headers and other information that can facilitate application development work. It is available for the tuna http, tuna postgres, tuna redis commands and is controlled by the --inspect flag or the TUNA_INSPECT environment variable.
Management
The request inspector is enabled by default and is available at http://127.0.0.1:4040. If port 4040 is busy, the next available port will be selected.
You can disable the inspector with the --inspect=false flag or the TUNA_INSPECT=false variable.
The address or port can be overridden using the TUNA_INSPECT_ADDR environment variable or the inspectAddr parameter in the configuration file.
TUNA_INSPECT_ADDR=0.0.0.0- listen on all interfacesTUNA_INSPECT_ADDR=0.0.0.0:8080- listen on all interfaces on port8080, if the port is busy, the next available port will be selectedTUNA_INSPECT_ADDR=8080- listen on address127.0.0.1on port8080, if the port is busy, the next available port will be selected
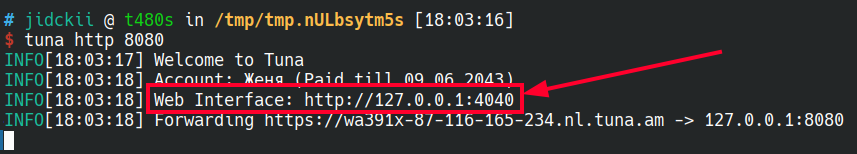
The final address will be printed in the console at startup:
Interface
By following the link, you will see a minimalist WEB interface with a list of executed requests. You can click on any request to view more detailed information about headers and other details.
Request list

You can also repeat requests, including with modifications:

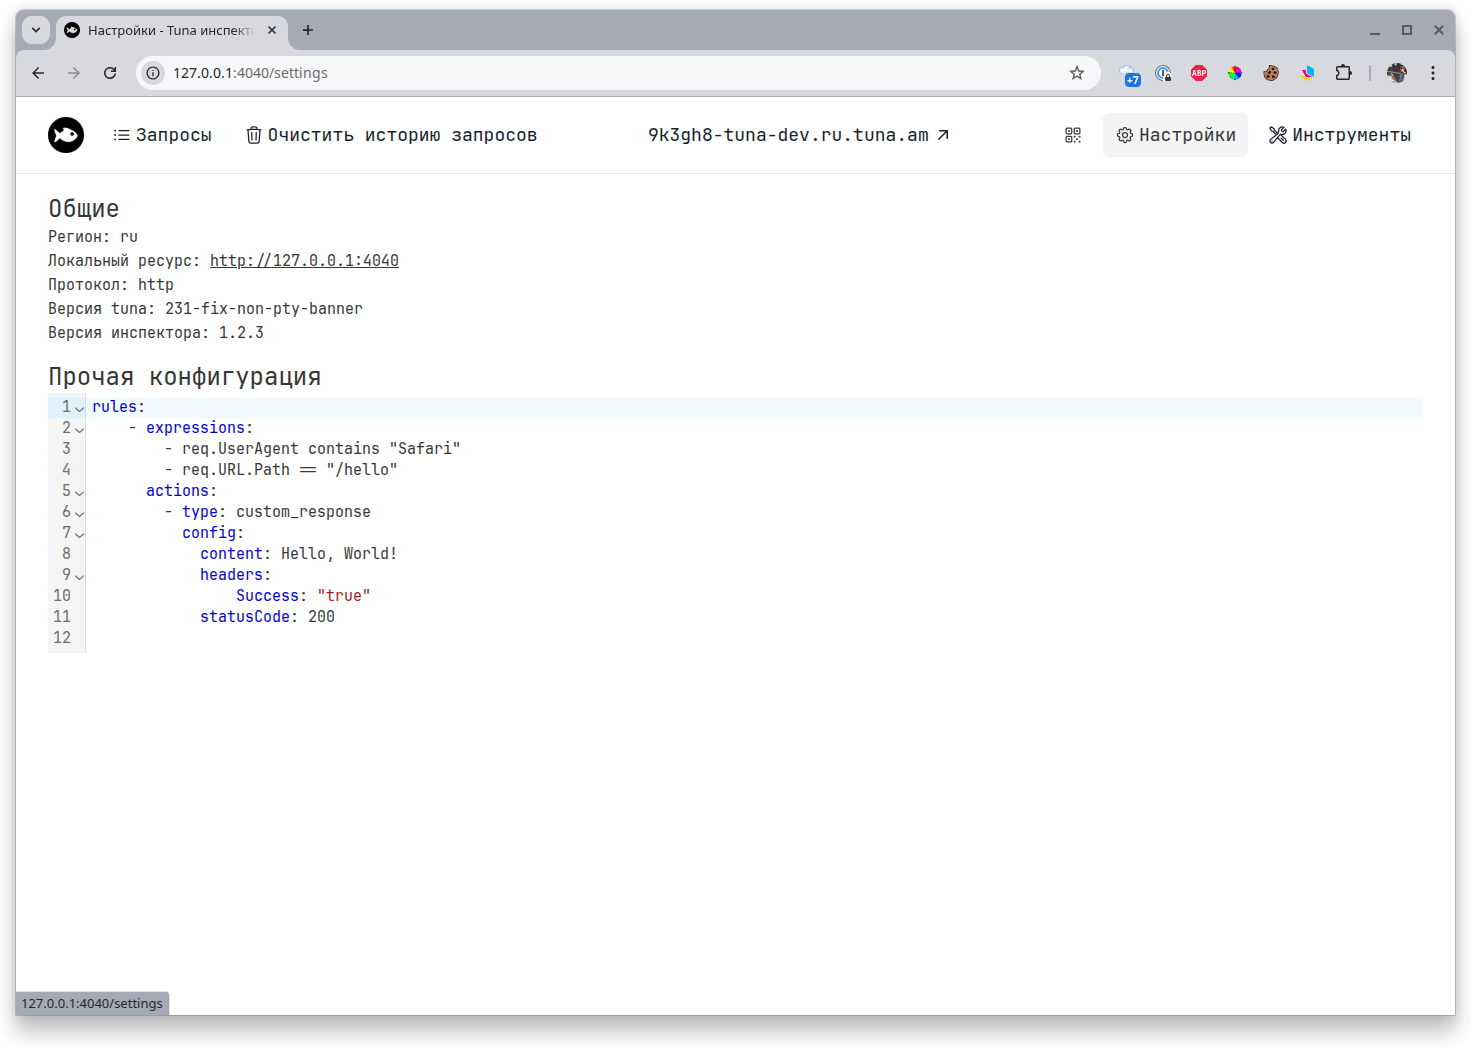
Settings
This displays general information and the current configuration of traffic policies.
Tools
For greater convenience, we have built developer tools right into the inspector.

On a separate tab you can find:
- CSV to JSON
- Base64 Encode/Decode
- JSON Formatter
- YAML to JSON
- URL Encode/Decode
- Timestamp to Date
- Query Parameters to JSON
- JSON to CSV
- JSON to YAML
- Number System Converter
- Regex Tester
- JWT Parser
- Hash Generator
- UUID Generator
- Lorem Ipsum Generator
If you didn't find the tool you need, contact us and we will consider the request.
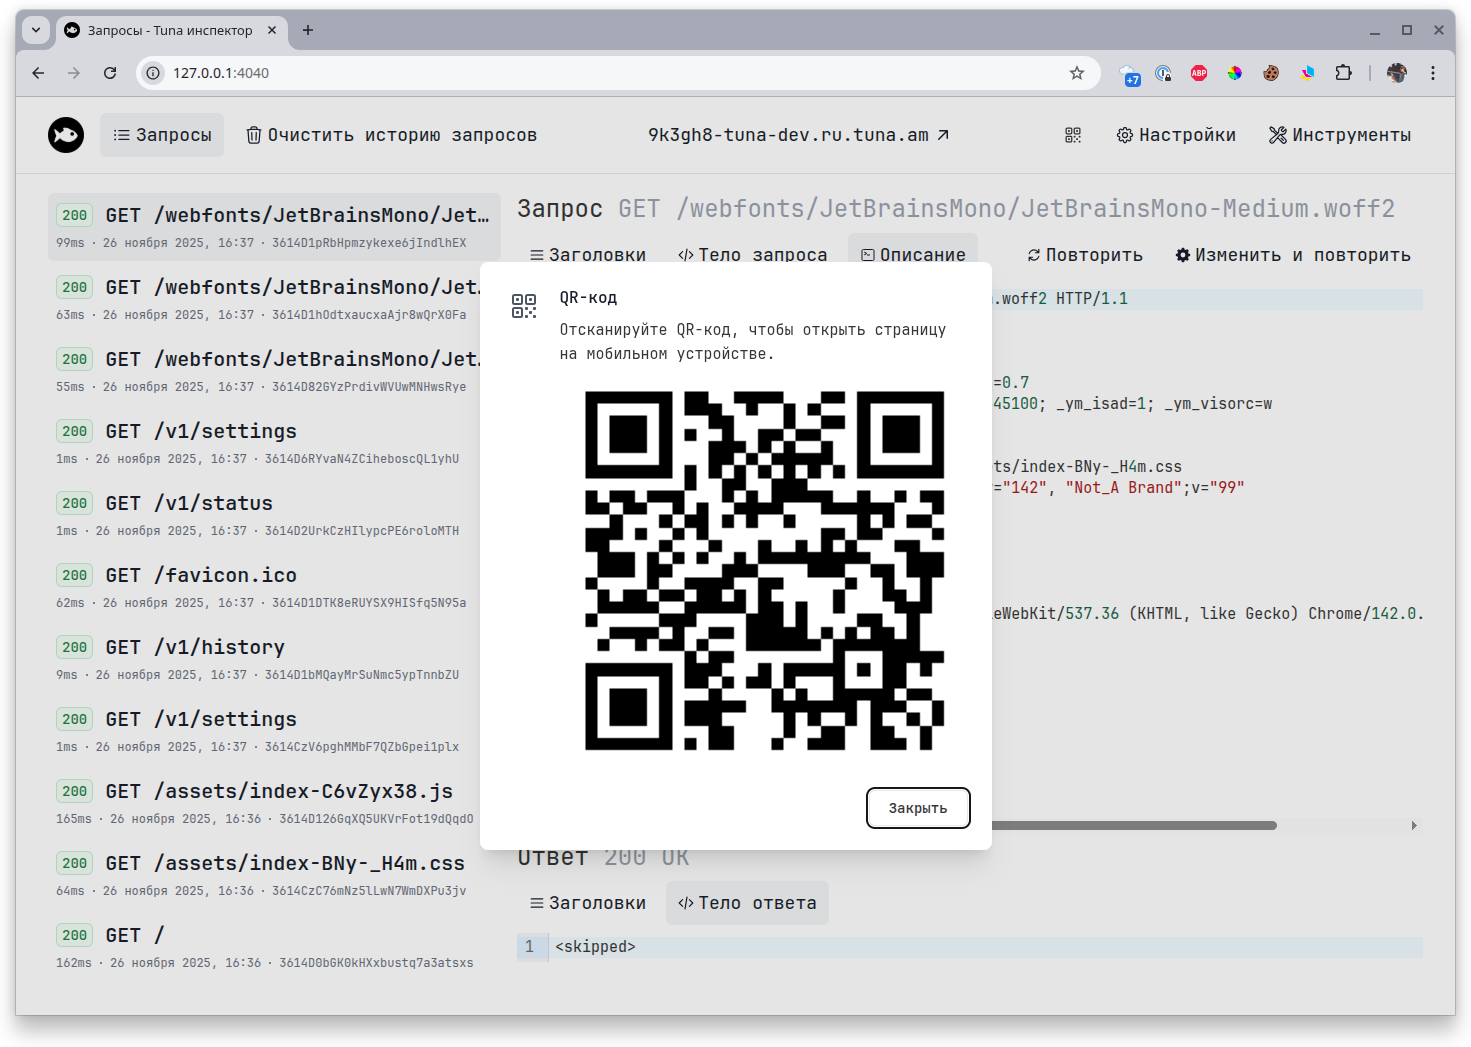
QR code
The QR code contains a link to the tunnel, which is convenient for mobile devices.