Redis tunnel
Available only with a subscription.
Overview
Redis tunnel allows you to provide access to a Redis database and track executed queries in the inspector.
Redis tunnels are designed for debugging and working locally or in test environments, they do not support SSL connections. We do not recommend using this type of tunnels in production environments.
Starting with version 0.36.0, tuna shows a full-screen interface in the terminal with sessions and Redis commands.
Examples
You can view all current flags, hints, and examples by calling help:
tuna redis --help
Almost all flags have corresponding environment variables.
Basic example
tuna redis 6379
With IP address
tuna redis 10.0.0.1:6379
Specifying a token
You can specify a particular token using the --token flag or the TUNA_TOKEN environment variable. Overriding follows the configuration ordering policy.
tuna redis 6379 --token=tt_***
Specifying a connection region
You can specify a particular region using the --location/-l flag or the TUNA_LOCATION environment variable. Overriding follows the configuration ordering policy.
tuna redis 6379 --location=nl
Static port
The value of the --port/-p flag can be an alias or an assigned port.
You can reserve ports in the dashboard, and after restarting the tunnel the address will remain the same.
For more details about ports, see the dedicated guide.
tuna redis 6379 --port=redis
tuna redis 6379 --port=35000
IP subnet access restriction
You can define a whitelist of subnets in CIDR format:
tuna redis 6379 --cidr-allow="10.0.0.1/32"
Or prohibit access from specific subnets:
tuna redis 6379 --cidr-deny="10.0.0.1/32"
You can combine them, for example specify a wide network and subtract private IPs:
tuna redis 6379 --cidr-allow="10.0.0.1/24" --cidr-deny="10.0.0.33/32"
You can also pass lists separated by commas:
tuna redis 6379 --cidr-allow="10.0.0.1/24,192.168.0.1/24" --cidr-deny="10.0.0.33/32,192.168.0.33/32"
Query inspector
The request inspector lets you debug incoming requests, view headers and other information that can make application development easier. It is controlled by the --inspect flag or the TUNA_INSPECT environment variable.
Configuration
The request inspector is enabled by default and is available at http://127.0.0.1:4040. If port 4040 is busy, the next free port will be selected. The address or port can be overridden using the TUNA_INSPECT_ADDR environment variable or the inspectAddr parameter in the configuration file.
TUNA_INSPECT_ADDR=0.0.0.0— listen on all interfacesTUNA_INSPECT_ADDR=0.0.0.0:8080— listen on all interfaces on port8080; if the port is busy, the next free one will be selectedTUNA_INSPECT_ADDR=8080— listen on127.0.0.1on port8080; if the port is busy, the next free one will be selected
The resulting address will be printed to the console at startup:

Interface
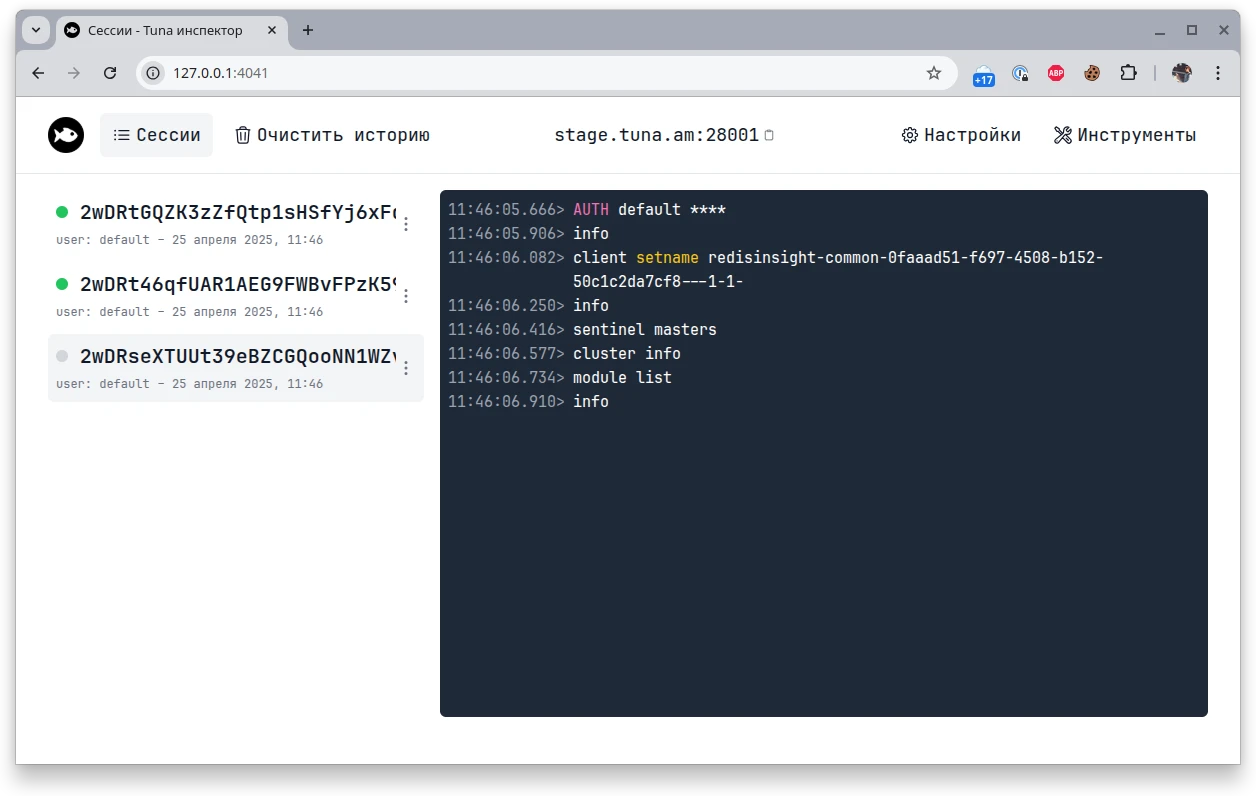
On the left, a list of sessions is displayed, and on the right, the output of commands that were executed within the sessions.