🆕 Reports - new functionality
We're pleased to introduce a new component of the Tuna platform - Reports. Designed for generating error reports on your website. With an embeddable script, users and QA engineers can easily show where the bug is hiding, and you get debugging information and can immediately start fixing it.
Go to Reports section in documentation
How does it work?
-
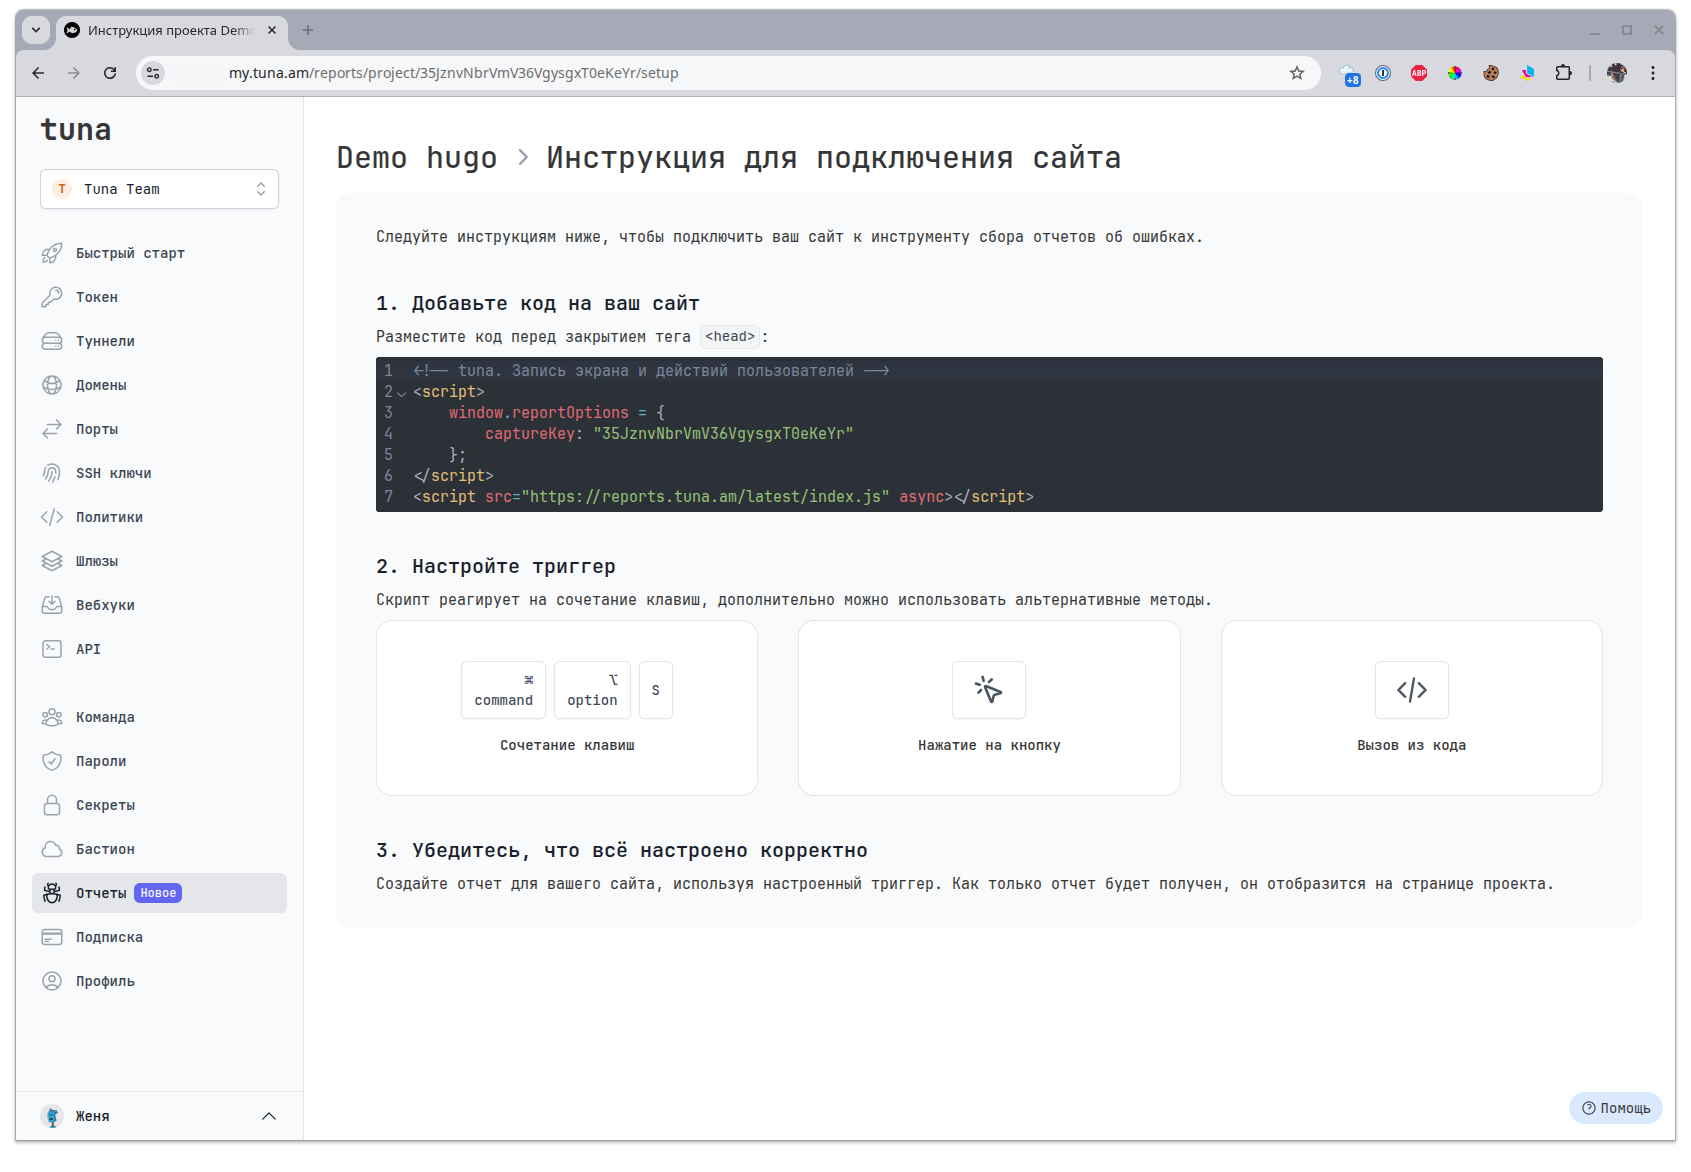
Go to your dashboard and create a project in the Reports section.
-
Add this code to your website before the closing
<head>tag:<!-- tuna. Screen and user actions recording --><script>window.reportOptions = {captureKey: "YOUR_CAPTURE_KEY"};</script><script src="https://reports.tuna.am/latest/index.js" async></script> -
Call the script with
CTRL + ALT + Sor⌘ + ⌥ + Sand create a report.
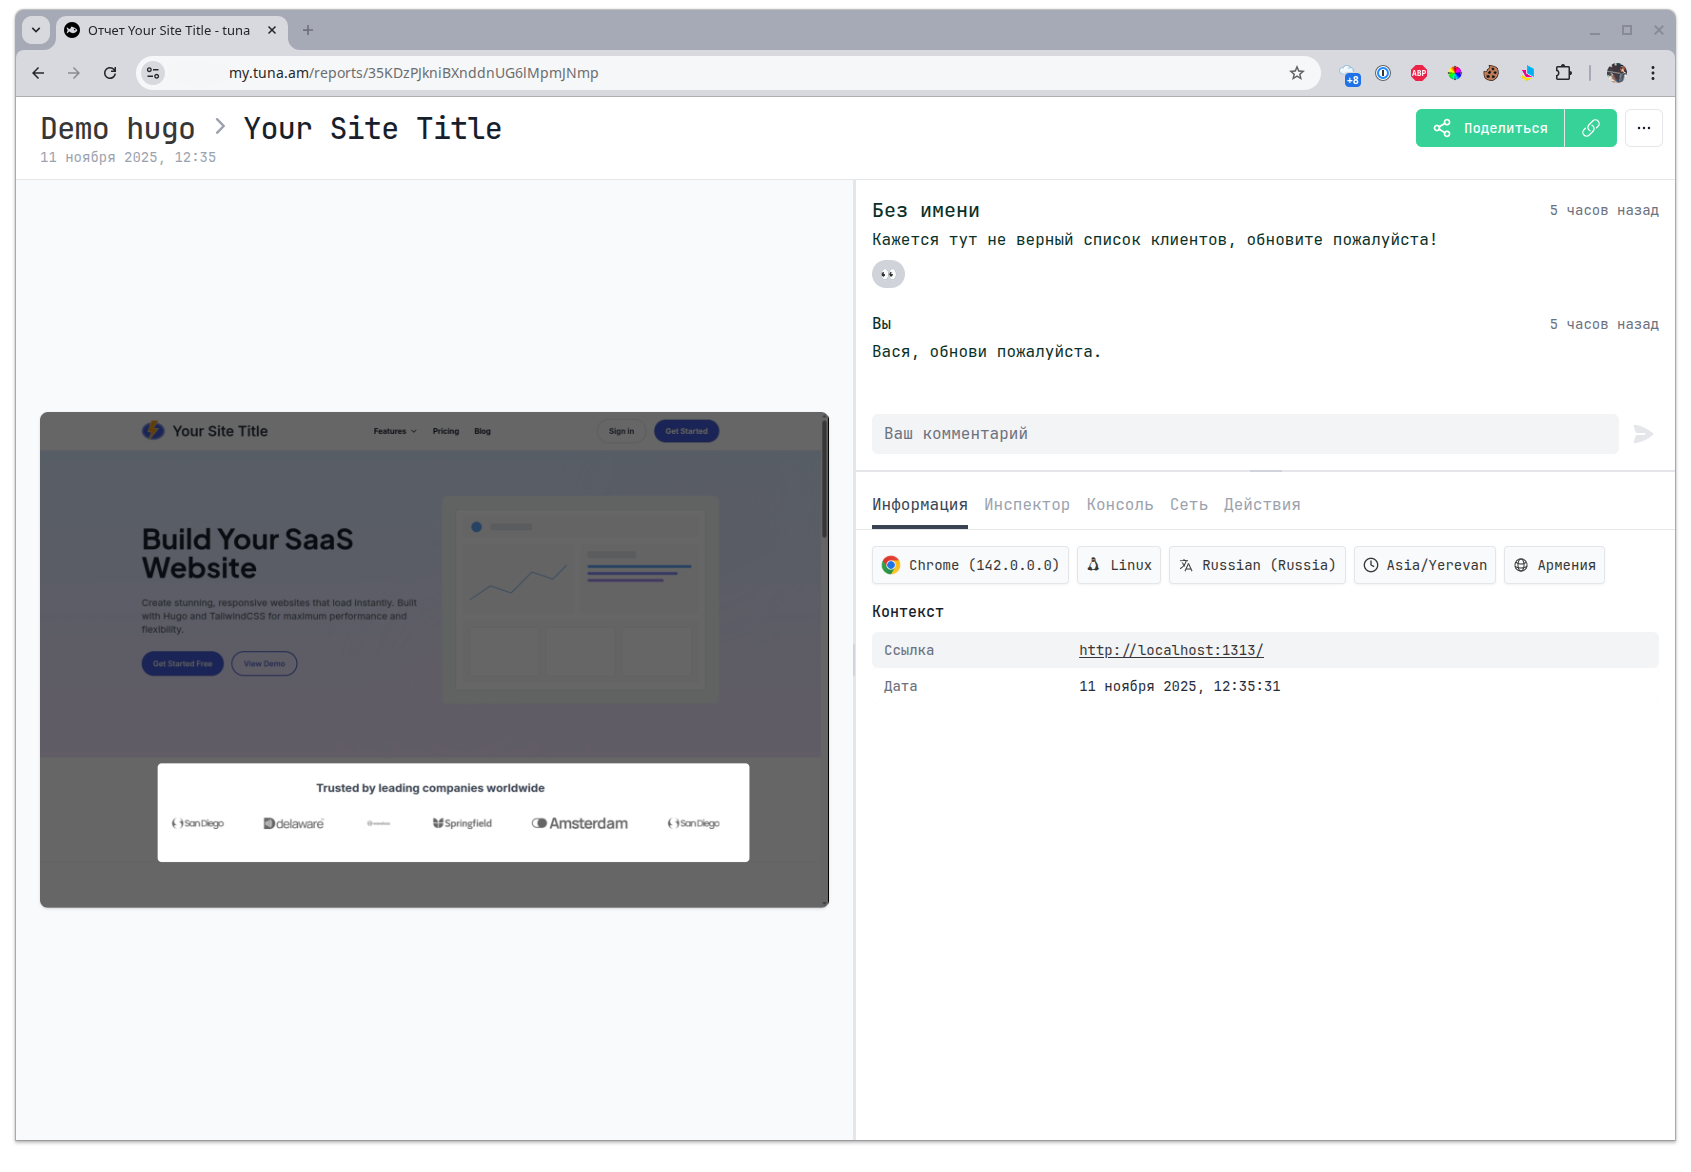
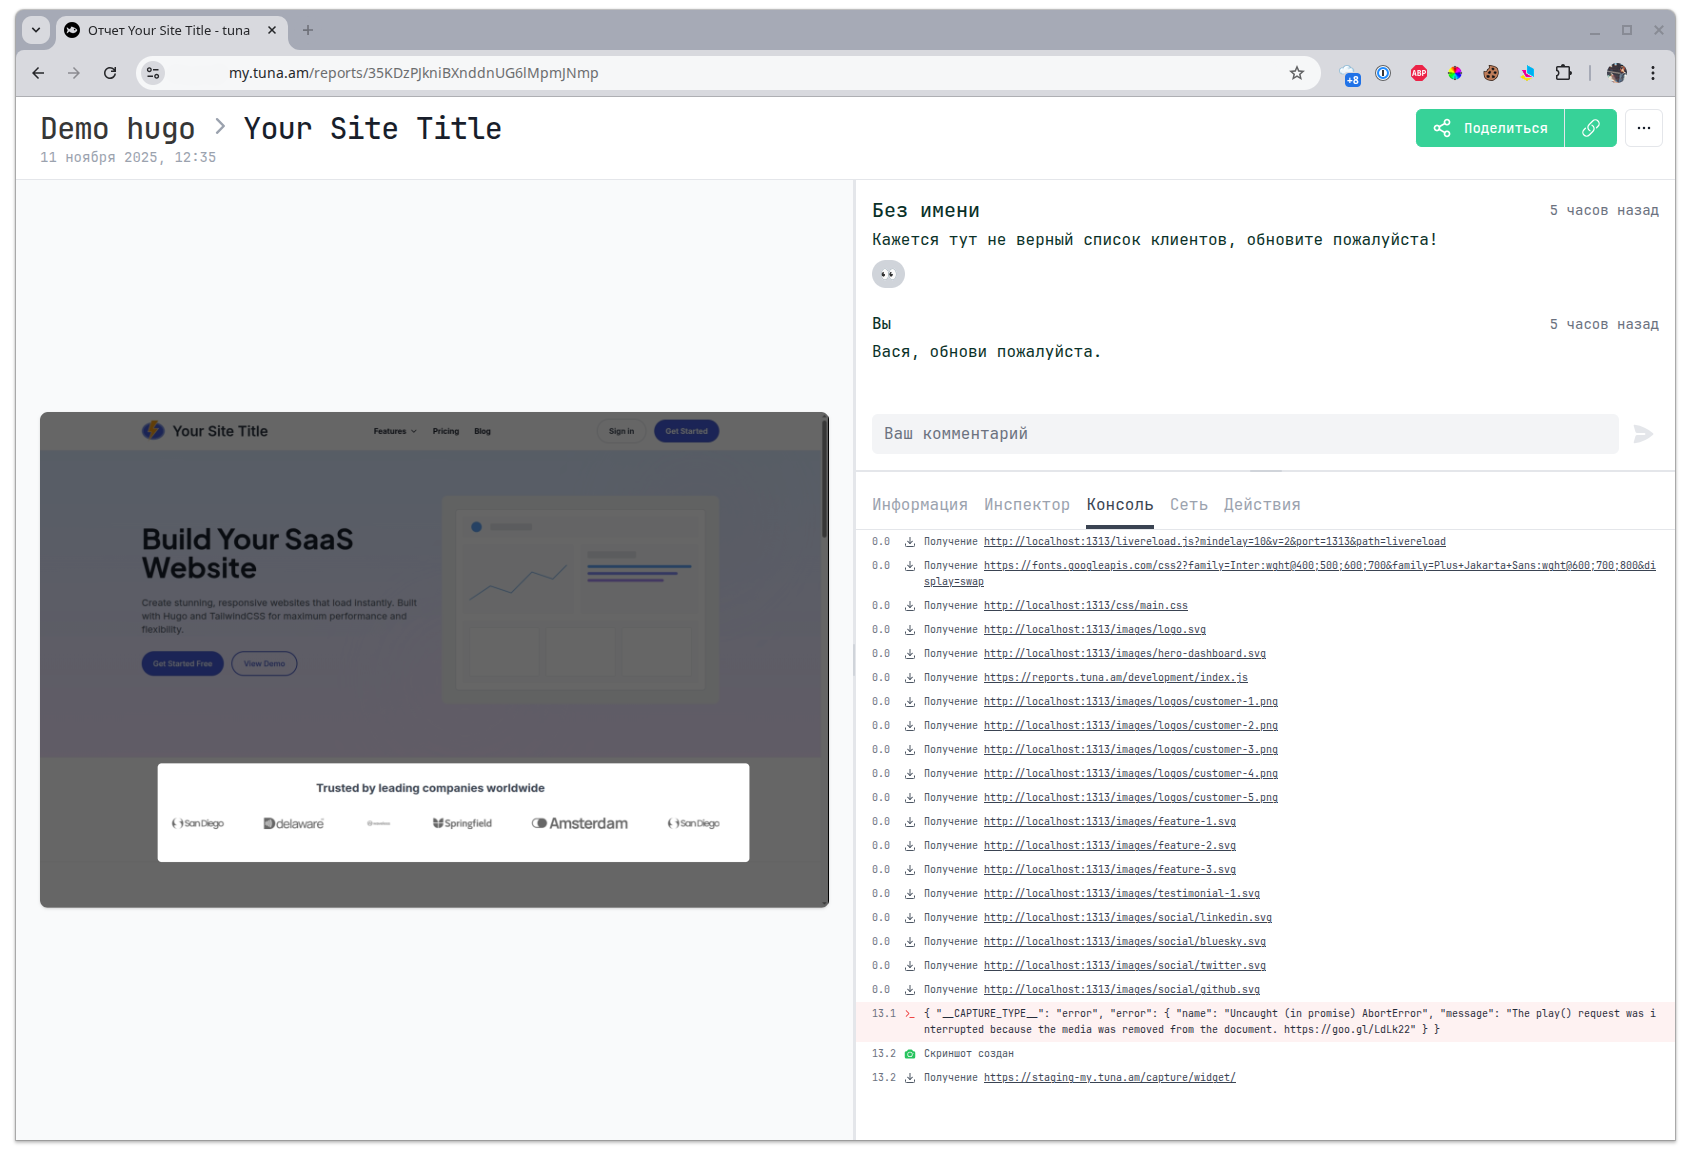
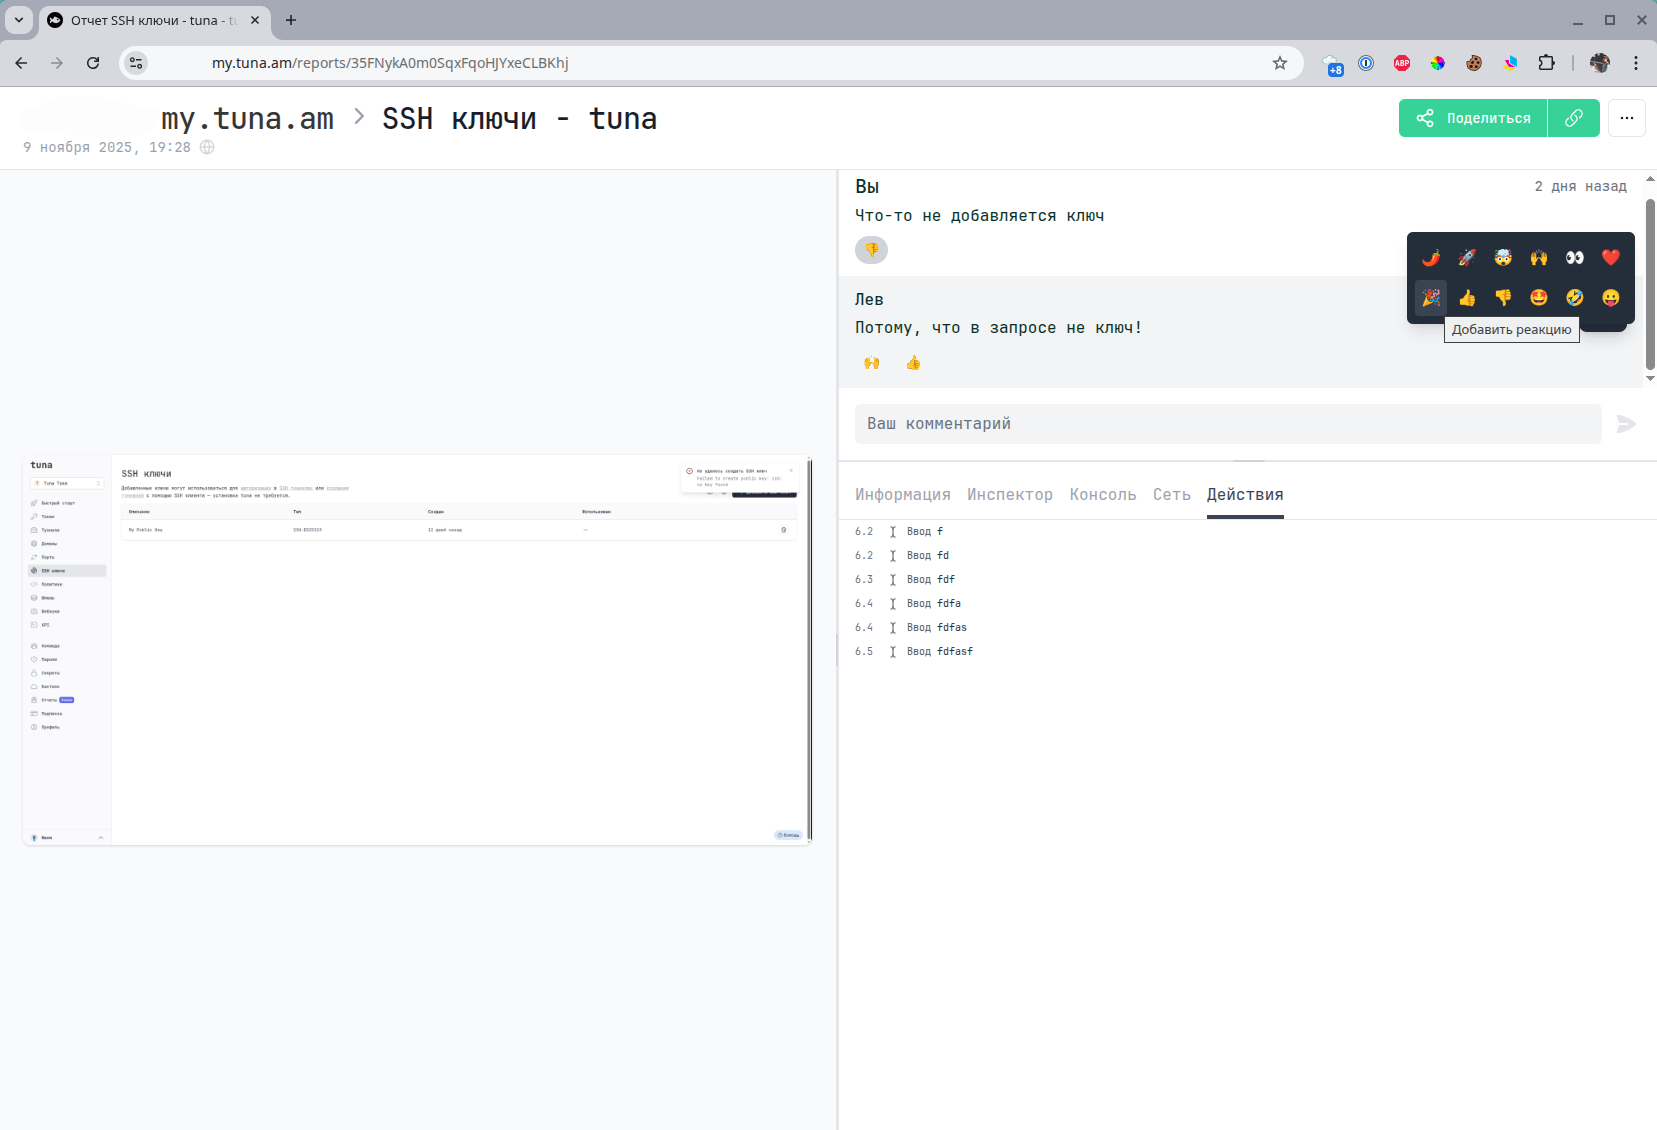
What does a report look like?
Inside the report you will find a screenshot or video and all the debugging information from the console, network operations, user actions and a snapshot of the page DOM tree.
- Info
- Inspector
- Console
- Network
- Actions
- Comments
The first tab contains general summary information about the client, device and browser.
A snapshot of the page DOM tree, with the ability to select an element.
This tab is only available for reports with a screenshot. Reports with video cannot capture a DOM tree snapshot since it can change over time.
A list of all events from the browser console.
A list of all XHR requests with the option to look into the details.
User actions on the page.

You can also leave comments and reactions to comments.
Video overview
- YouTube
- VK Video
Leave feedback
If you enjoy using Tuna, or on the contrary you are not happy with something, please leave feedback.
Help
We value our users and carefully review every request. If you have any problems with tuna, please contact us in one of the following ways: