Heartbeat
The Heartbeat monitor is designed to track regular signals from services running in closed networks, IoT devices or background processes.
How it works
- You create a Heartbeat monitor and set the expected signal interval
- Your application periodically sends a
pingsignal - If no signal arrives within the configured time — a notification is sent
Parameters
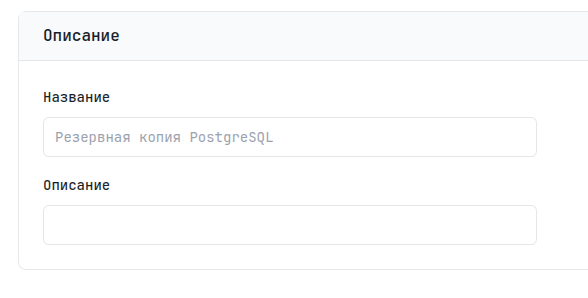
Description
| Parameter | Description | Required |
|---|---|---|
| Name | Unique monitor name | Yes |
| Description | A note about the task purpose | No |
Details
Specify the expected interval between jobs and optionally the maximum execution time.
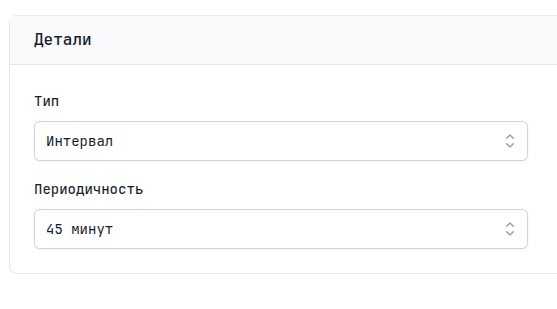
Interval
Two types of schedule are supported:
- Interval
- Cron expression
Expected interval between signals:
| Value | Description |
|---|---|
| 1 minute | Signal expected every minute |
| 5 minutes | Signal expected every 5 minutes |
| 15 minutes | Signal expected every 15 minutes |
| 30 minutes | Signal expected every 30 minutes |
| 60 minutes | Signal expected every hour |
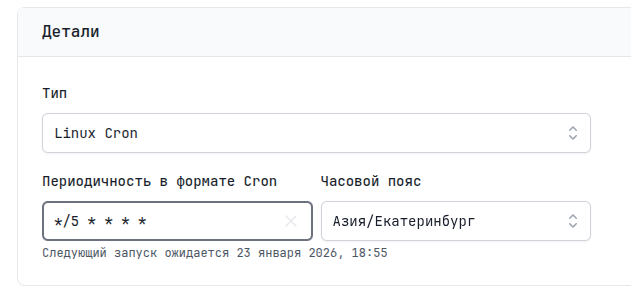
For irregular schedules use a Cron expression:
┌───────────── minute (0 - 59)
│ ┌───────────── hour (0 - 23)
│ │ ┌───────────── day of month (1 - 31)
│ │ │ ┌───────────── month (1 - 12)
│ │ │ │ ┌───────────── day of week (0 - 6)
│ │ │ │ │
* * * * *
Examples:
| Expression | Description |
|---|---|
*/5 * * * * | Every 5 minutes |
0 * * * * | Every hour |
0 9-18 * * 1-5 | Every hour from 9 to 18 on weekdays |
Notifications
The Heartbeat monitor sends notifications in the following cases:
| Reason | Description |
|---|---|
| Not Running | The job did not start within the Grace Period |
| Recovery | The job recovered after an error |
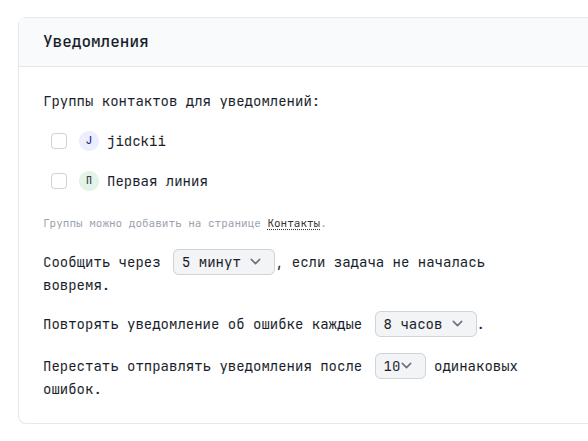
Here you can specify contact groups for notifications. If left unspecified, the user's email is used.
You can also set a waiting period — Grace Period. It is added to the expected time of the next signal. For example, if the interval is 5 minutes and the Grace Period is 2 minutes, the alert will be sent 7 minutes after the last signal. Repeated notifications remind you of the problem; you can set the interval and number of these reminders.
Usage
Through the CLI
# Simple ping
tuna monitor ping MONITOR_ID

# With explicit host (useful for identifying the source)
tuna monitor ping MONITOR_ID --host=server-01

# With a message
tuna monitor ping MONITOR_ID --message="All systems operational"
Via HTTP
In addition to the tuna CLI, you can send signals directly via HTTP requests. This is useful when the CLI is unavailable or when you use other programming languages.
URL format:
https://monitor.tuna.am/{MONITOR_ID}/{slug-name}
{slug-name} is optional and is mainly used for easy identification of the monitor in code.
- curl
- wget
- Python
- PowerShell
# Simple ping
curl -s "https://monitor.tuna.am/MONITOR_ID/test"

# With explicit status
curl -s "https://monitor.tuna.am/MONITOR_ID/test?state=ping"
curl -s "https://monitor.tuna.am/MONITOR_ID/test?state=start"
curl -s "https://monitor.tuna.am/MONITOR_ID/test?state=finish"
curl -s "https://monitor.tuna.am/MONITOR_ID/test?state=fail"

# With a message (proper UTF-8 encoding)
curl -G "https://monitor.tuna.am/MONITOR_ID/test" \
  --data-urlencode "message=Backup completed successfully"

# With host and message
curl -G "https://monitor.tuna.am/MONITOR_ID/test?host=server-01" \
  --data-urlencode "message=All systems operational"
# Simple ping
wget -qO- "https://monitor.tuna.am/MONITOR_ID/test"

# With parameters
wget -qO- "https://monitor.tuna.am/MONITOR_ID/test?state=ping&host=server-01"
import requests
from urllib.parse import urlencode

MONITOR_ID = "your_monitor_id"
BASE_URL = f"https://monitor.tuna.am/{ENDPOINT_TOKEN}"

# Simple ping
requests.get(BASE_URL)

# With parameters
params = {
    "state": "ping",
    "host": "server-01",
    "message": "Task completed successfully"
}
requests.get(BASE_URL, params=params)
# Simple ping
Invoke-WebRequest -Uri "https://monitor.tuna.am/MONITOR_ID/test" -Method GET

# With parameters
$params = @{
    state = "ping"
    host = "server-01"
    message = "Backup completed"
}
$uri = "https://monitor.tuna.am/MONITOR_ID/test"
Invoke-WebRequest -Uri $uri -Method GET -Body $params
Request parameters
| Parameter | Description |
|---|---|
state | Signal status: ping, start, finish, fail |
host | Host identifier (useful when there are multiple sources) |
message | Arbitrary message |
In a systemd service
# /etc/systemd/system/my-heartbeat.service
[Unit]
Description=Heartbeat ping to Tuna
After=network.target

[Service]
Type=oneshot
ExecStart=/usr/local/bin/tuna monitor ping MONITOR_ID

[Install]
WantedBy=multi-user.target
# /etc/systemd/system/my-heartbeat.timer
[Unit]
Description=Run heartbeat every 5 minutes

[Timer]
OnBootSec=1min
OnUnitActiveSec=5min

[Install]
WantedBy=timers.target
systemctl enable --now my-heartbeat.timer
In crontab
# Heartbeat every 5 minutes
*/5 * * * * /usr/local/bin/tuna monitor ping MONITOR_ID
Statuses
| Status | Description |
|---|---|
| New | Monitor created, awaiting the first signal |
| Up | Signals are arriving regularly |
| Down | The signal did not arrive in time |
Examples
Monitoring an office GitLab Runner
# On the GitLab Runner machine
*/5 * * * * /usr/local/bin/tuna monitor ping MONITOR_ID --host=gitLab-runner-0
Monitoring a VPN connection
#!/bin/bash
# Check the VPN channel and send a heartbeat only if the connection is up

ping -c 1 192.168.14.88 && tuna monitor ping MONITOR_ID --message="VPN is up"