Job
The Job monitor is designed to track execution of periodic jobs: backup scripts, cron jobs and other scheduled operations.
How it works
- You create a Job monitor and define the execution schedule
- When the job starts, the
startsignal is sent - On successful completion the
finishsignal is sent - On error the
failsignal is sent - The system tracks both timely starts and execution time
Parameters
Description
| Parameter | Description | Required |
|---|---|---|
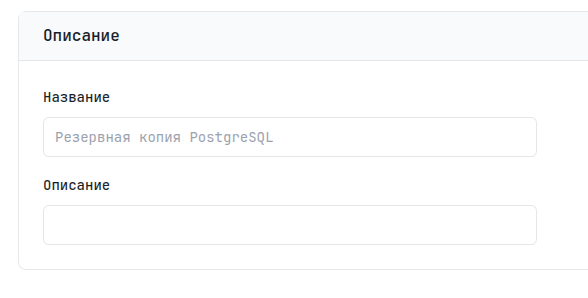
| Name | Unique monitor name | Yes |
| Description | A note about the task purpose | No |
Details
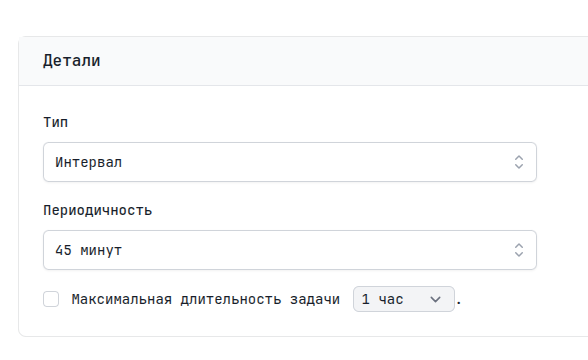
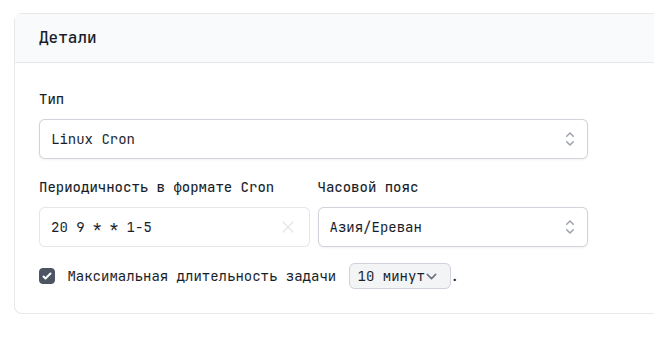
Specify the expected interval between jobs and optionally the maximum execution time.
Interval
Two types of schedule are supported:
- Interval
- Cron expression
Expected interval between signals:
| Value | Description |
|---|---|
| 1 minute | Signal expected every minute |
| 5 minutes | Signal expected every 5 minutes |
| 15 minutes | Signal expected every 15 minutes |
| 30 minutes | Signal expected every 30 minutes |
| 60 minutes | Signal expected every hour |
For irregular schedules use a Cron expression:
┌───────────── minute (0 - 59)
│ ┌───────────── hour (0 - 23)
│ │ ┌───────────── day of month (1 - 31)
│ │ │ ┌───────────── month (1 - 12)
│ │ │ │ ┌───────────── day of week (0 - 6)
│ │ │ │ │
* * * * *
Examples:
| Expression | Description |
|---|---|
*/5 * * * * | Every 5 minutes |
0 * * * * | Every hour |
0 9-18 * * 1-5 | Every hour from 9 to 18 on weekdays |
Execution time
The maximum job duration Running Time — if the job runs longer than the specified time, a notification is sent.
Notifications
The Job monitor sends notifications in the following cases:
| Reason | Description |
|---|---|
| Fail | The job finished with an error (fail signal or exit code != 0) |
| Not Running | The job did not start within the Grace Period |
| Long Running | The job runs longer than the Running Time |
| Recovery | The job recovered after an error |
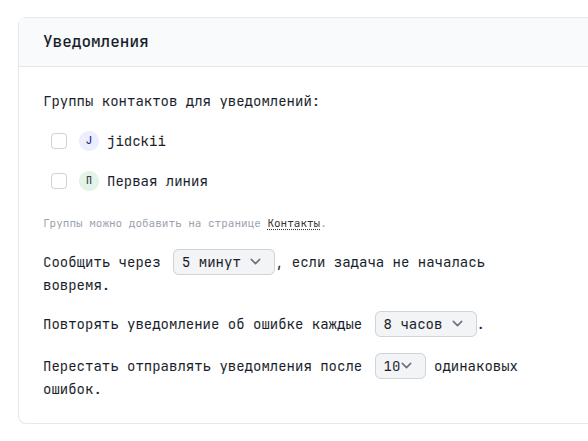
Here you can specify contact groups for notifications. If left unspecified, the user's email is used.
You can also set a waiting period — Grace Period. It is added to the expected time of the next signal. For example, if the interval is 5 minutes and the Grace Period is 2 minutes, the alert will be sent 7 minutes after the last signal. Repeated notifications remind you of the problem; you can set the interval and number of these reminders.
Usage
Through the CLI (recommended)
The tuna monitor exec command automatically sends start, finish or fail signals:
tuna monitor exec MONITOR_ID -- ./backup.sh
If you want to control the signals manually:
# Start of execution
tuna monitor ping MONITOR_ID --state=start

# Run your job
./your-task.sh

# Successful completion
tuna monitor ping MONITOR_ID --state=finish

# Or error
tuna monitor ping MONITOR_ID --state=fail
Via HTTP
In addition to the tuna CLI, you can send signals directly via HTTP requests. This is useful when the CLI is unavailable or when you use other programming languages.
URL format:
https://monitor.tuna.am/{MONITOR_ID}/{slug-name}
{slug-name} is optional and is mainly used for easy identification of the monitor in code.
- curl
- wget
- Python
- PowerShell
# Simple ping
curl -s "https://monitor.tuna.am/MONITOR_ID/test"

# With explicit status
curl -s "https://monitor.tuna.am/MONITOR_ID/test?state=ping"
curl -s "https://monitor.tuna.am/MONITOR_ID/test?state=start"
curl -s "https://monitor.tuna.am/MONITOR_ID/test?state=finish"
curl -s "https://monitor.tuna.am/MONITOR_ID/test?state=fail"

# With a message (proper UTF-8 encoding)
curl -G "https://monitor.tuna.am/MONITOR_ID/test" \
  --data-urlencode "message=Backup completed successfully"

# With host and message
curl -G "https://monitor.tuna.am/MONITOR_ID/test?host=server-01" \
  --data-urlencode "message=All systems operational"
# Simple ping
wget -qO- "https://monitor.tuna.am/MONITOR_ID/test"

# With parameters
wget -qO- "https://monitor.tuna.am/MONITOR_ID/test?state=ping&host=server-01"
import requests
from urllib.parse import urlencode

MONITOR_ID = "your_monitor_id"
BASE_URL = f"https://monitor.tuna.am/{ENDPOINT_TOKEN}"

# Simple ping
requests.get(BASE_URL)

# With parameters
params = {
    "state": "ping",
    "host": "server-01",
    "message": "Task completed successfully"
}
requests.get(BASE_URL, params=params)
# Simple ping
Invoke-WebRequest -Uri "https://monitor.tuna.am/MONITOR_ID/test" -Method GET

# With parameters
$params = @{
    state = "ping"
    host = "server-01"
    message = "Backup completed"
}
$uri = "https://monitor.tuna.am/MONITOR_ID/test"
Invoke-WebRequest -Uri $uri -Method GET -Body $params
Request parameters
| Parameter | Description |
|---|---|
state | Signal status: ping, start, finish, fail |
host | Host identifier (useful when there are multiple sources) |
message | Arbitrary message |
See more: Working with monitors in the CLI
Statuses
| Status | Description |
|---|---|
| New | Monitor created, awaiting the first run |
| Running | The job is running (the start signal was received) |
| Up | The job finished successfully (the finish signal was received) |
| Down | The job finished with an error or did not start in time |
Logging
When tuna monitor exec is used, the system automatically captures stdout and stderr of your job. The logs can be viewed in the UI in the monitor's event history.
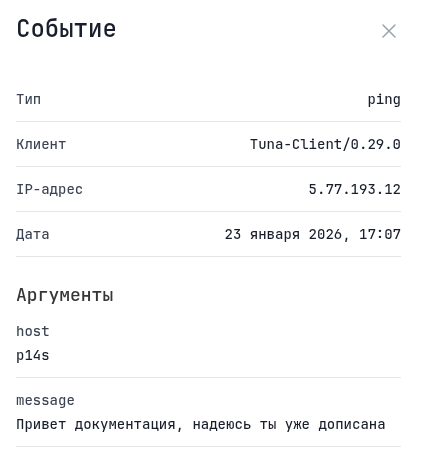
To disable sending logs use the --no-stdout flag:
tuna monitor exec MONITOR_ID --no-stdout -- ./task.sh
Examples
PostgreSQL backup
#!/bin/bash
# /scripts/backup-postgres.sh

tuna monitor exec MONITOR_ID -- pg_dump -U postgres mydb > /backups/mydb_$(date +%Y%m%d).sql
Data synchronization
#!/bin/bash
# /scripts/sync-data.sh

tuna monitor exec MONITOR_ID -- rsync -avz /data/ remote:/backup/data/
Crontab
# Database backup every night at 3:00
0 3 * * * tuna monitor exec MONITOR_ID -- /scripts/backup-db.sh

# Log cleanup every hour
0 * * * * tuna monitor exec MONITOR_ID -- /scripts/cleanup-logs.sh